TacticScale
Built for winning traders
Three tools you already use — rebuilt around digested insights instead of raw data.
Your signal scanner ranks your entire watchlist across 9 timeframes in one click. Your screener finds divergence setups across thousands of stocks you'd never spot manually. Your journal doesn't just log trades — it catches your panic sells and FOMO buys with hard numbers.
Native Mac app with free local AI Review — Apple Silicon, no monthly fee.
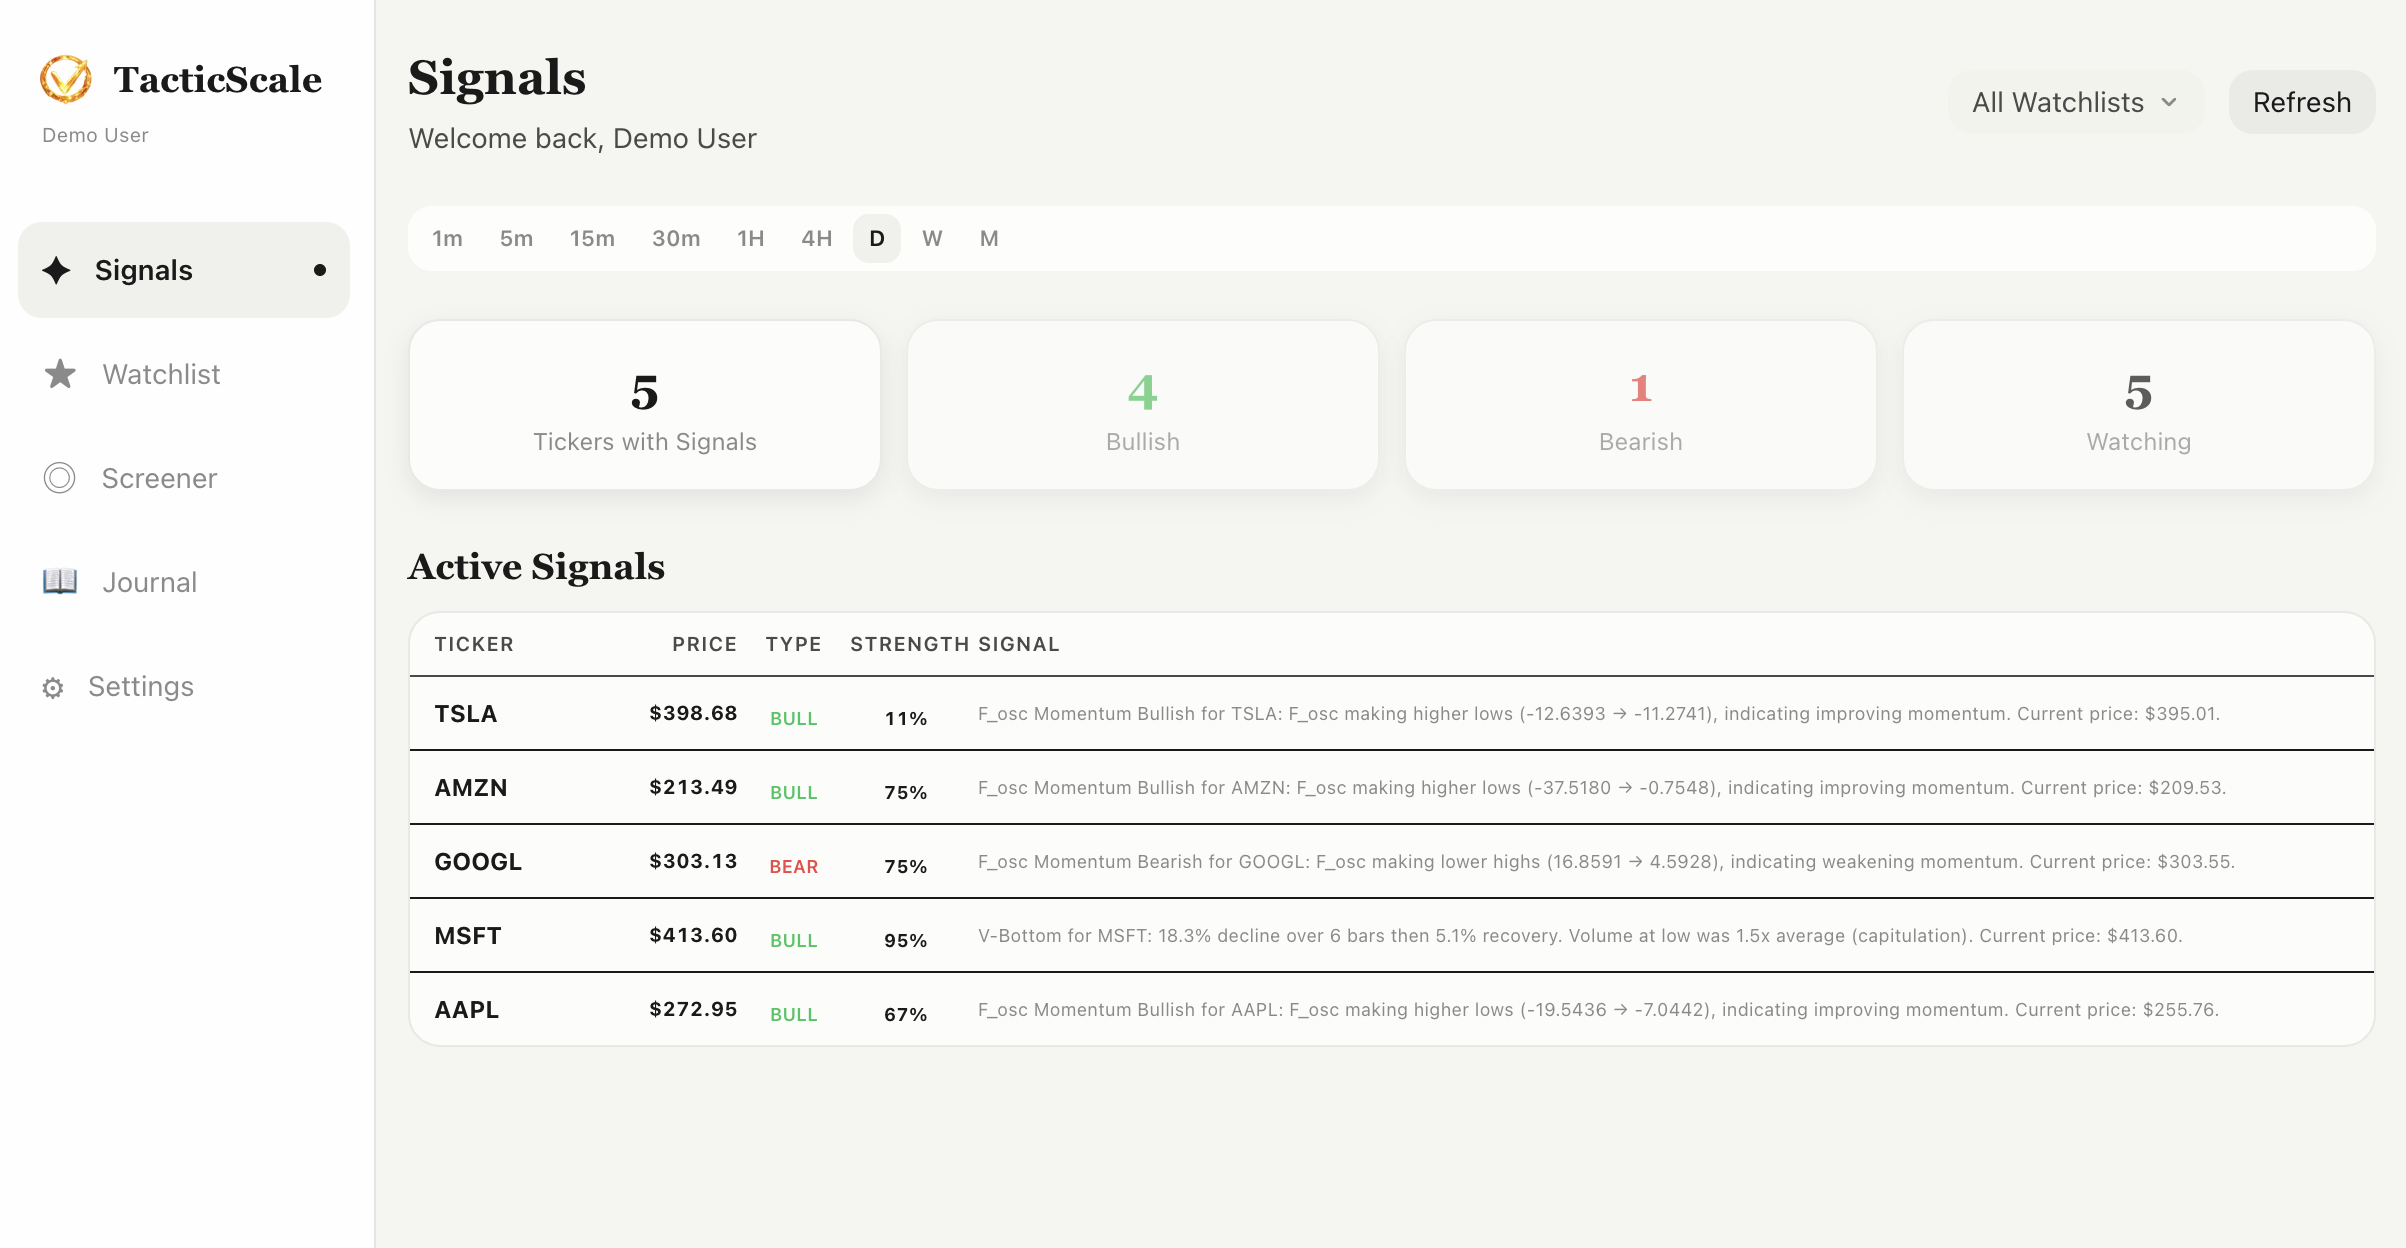
Signal Dashboard
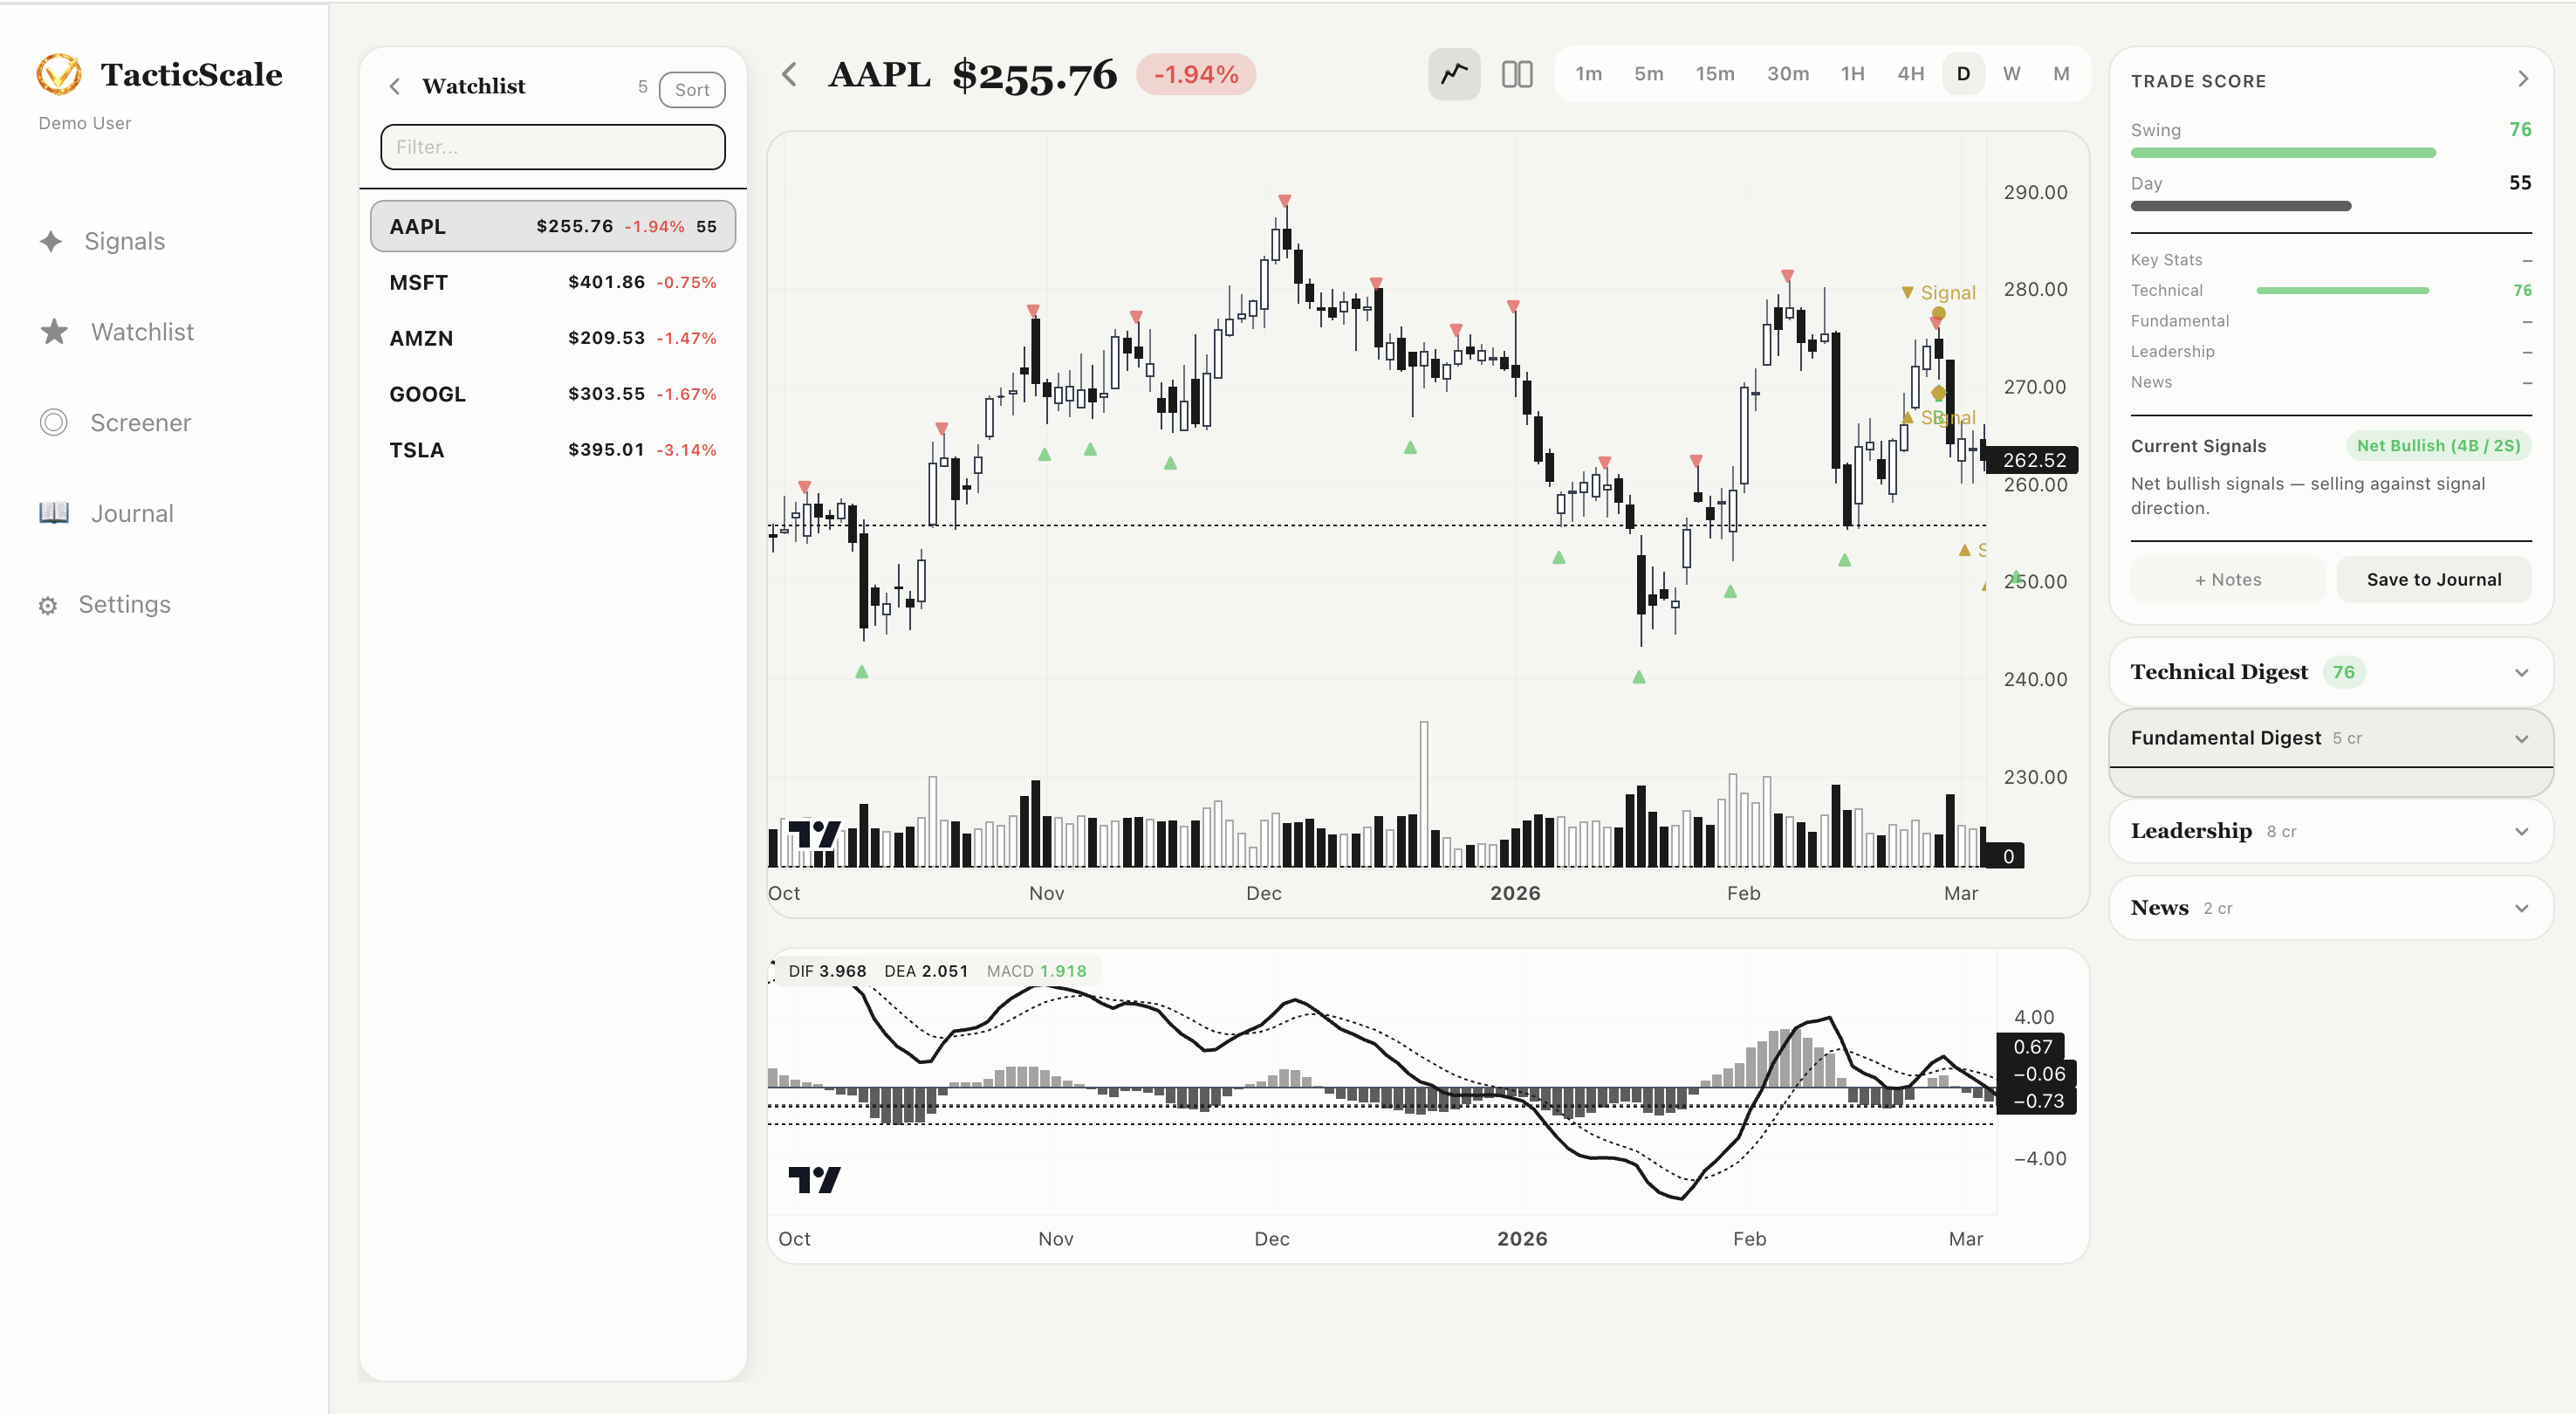
Interactive Chart Analysis
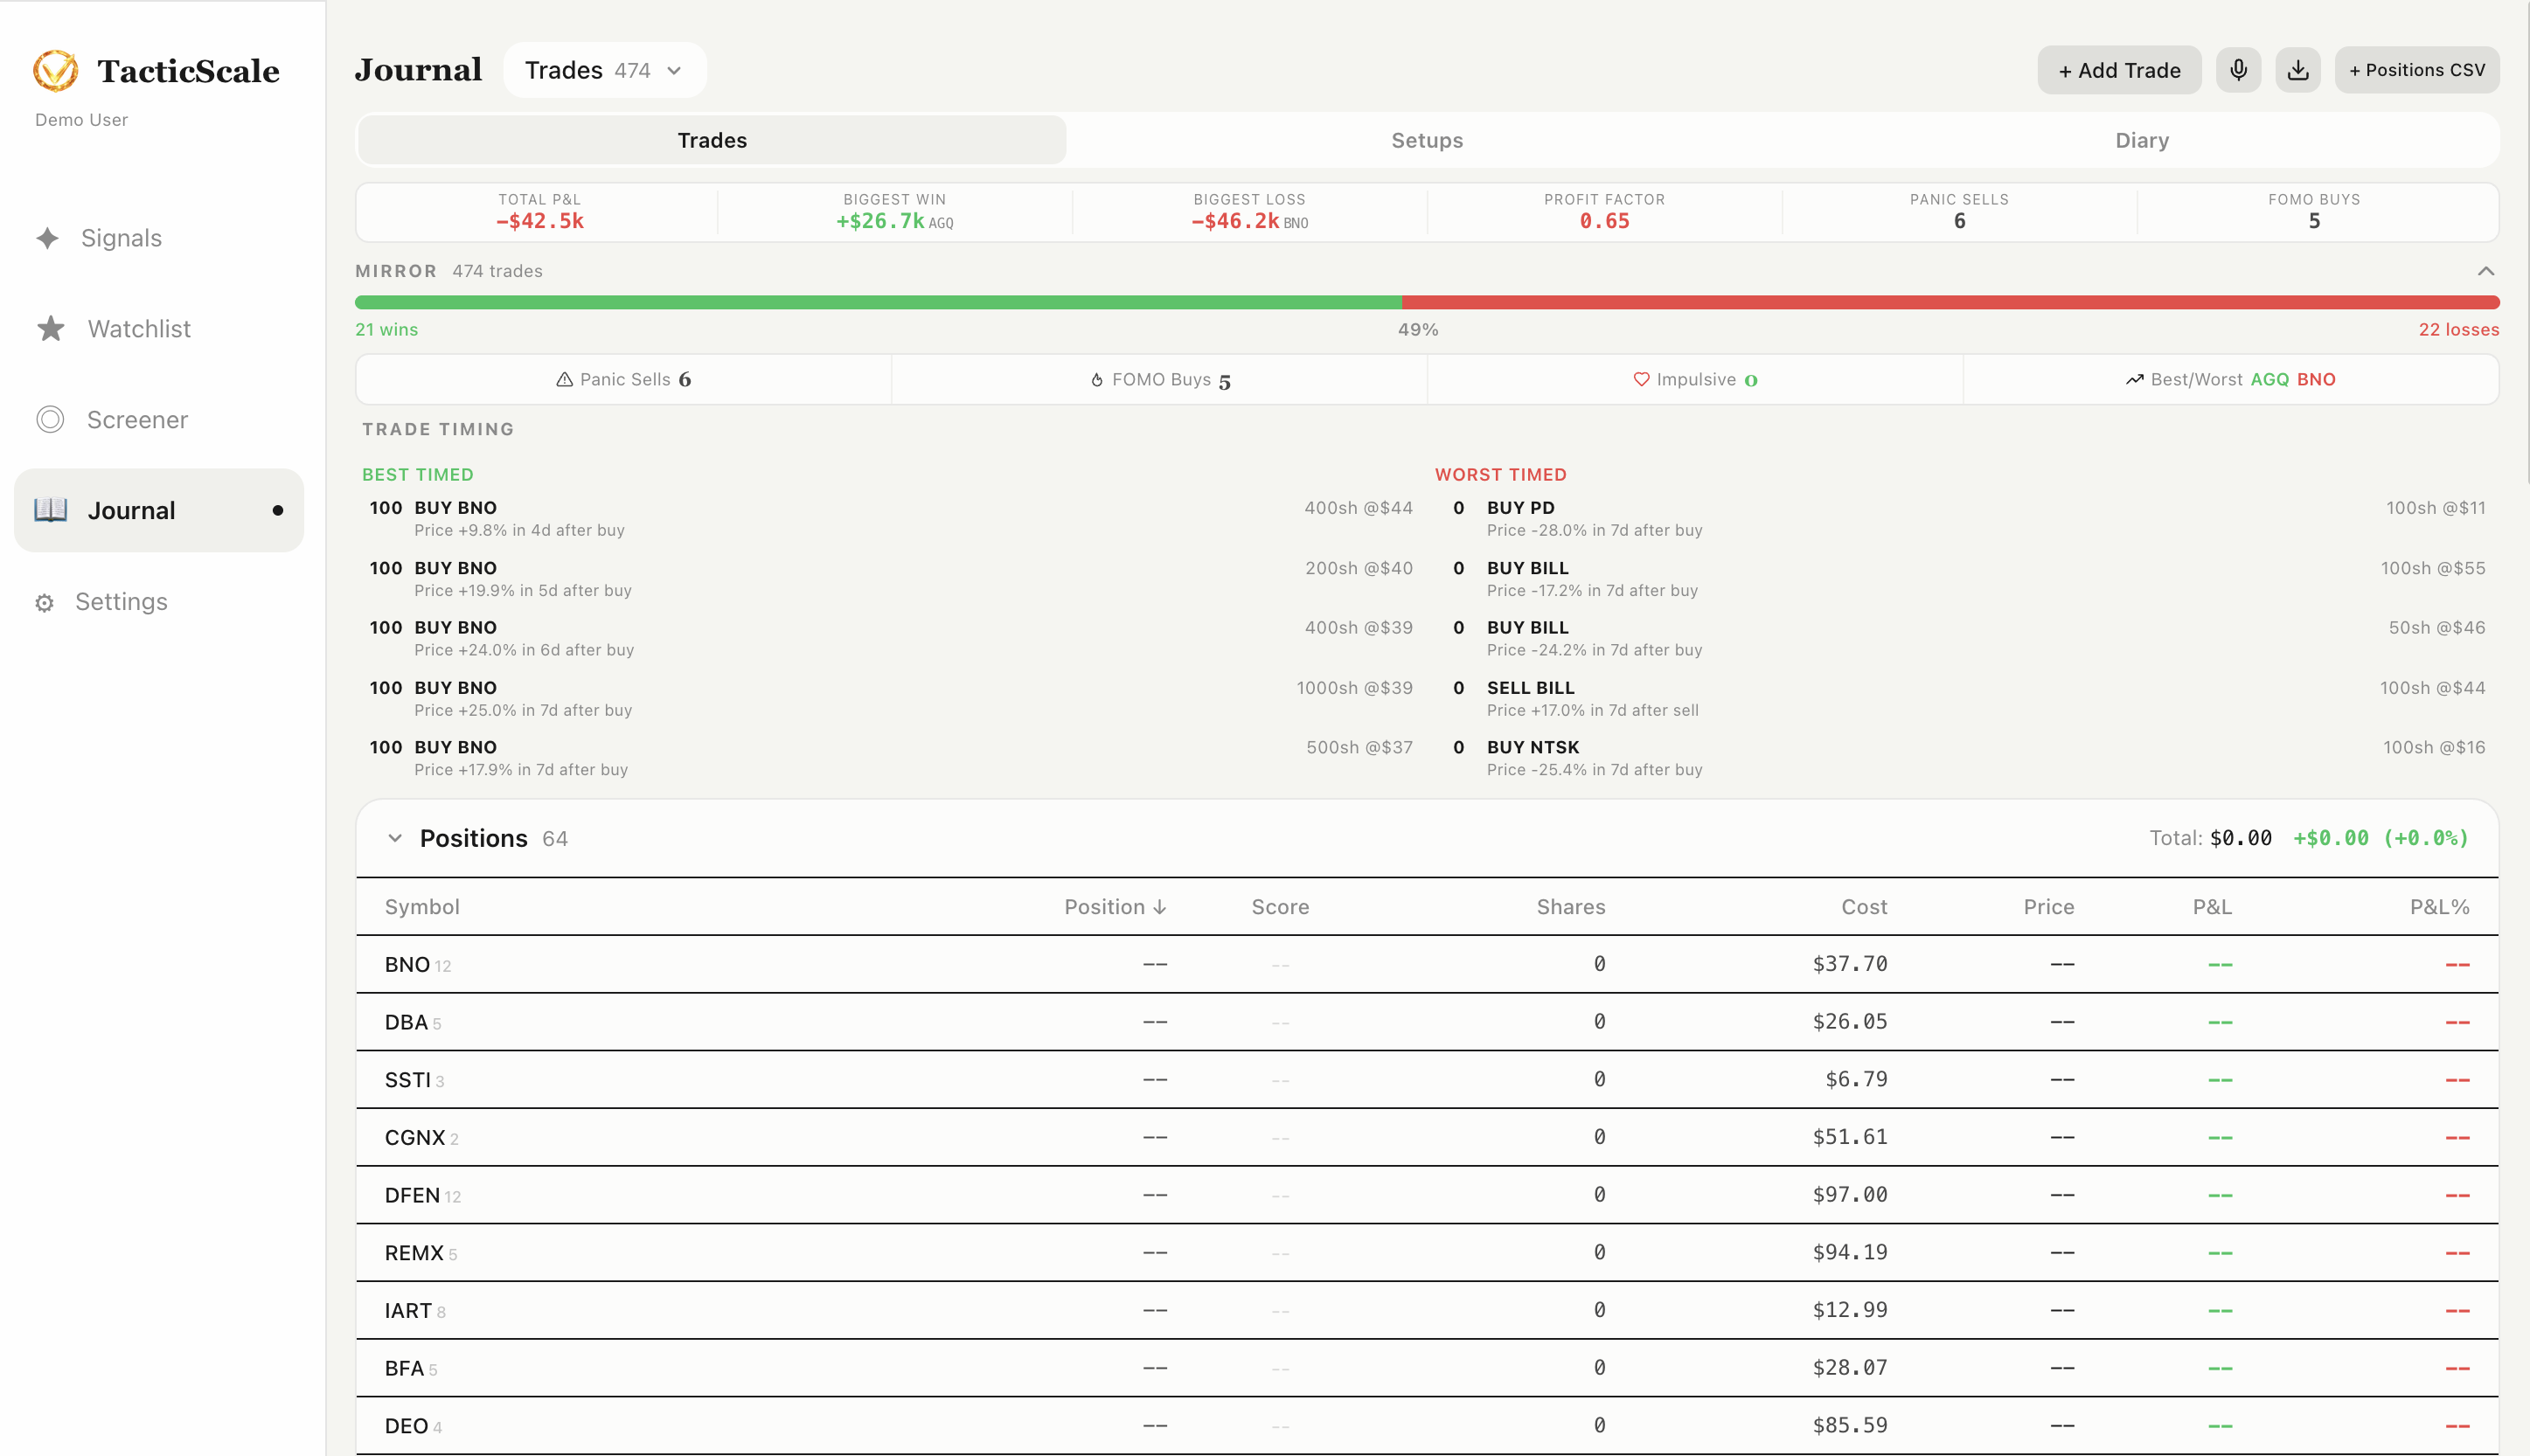
Trade Journal & MIRROR
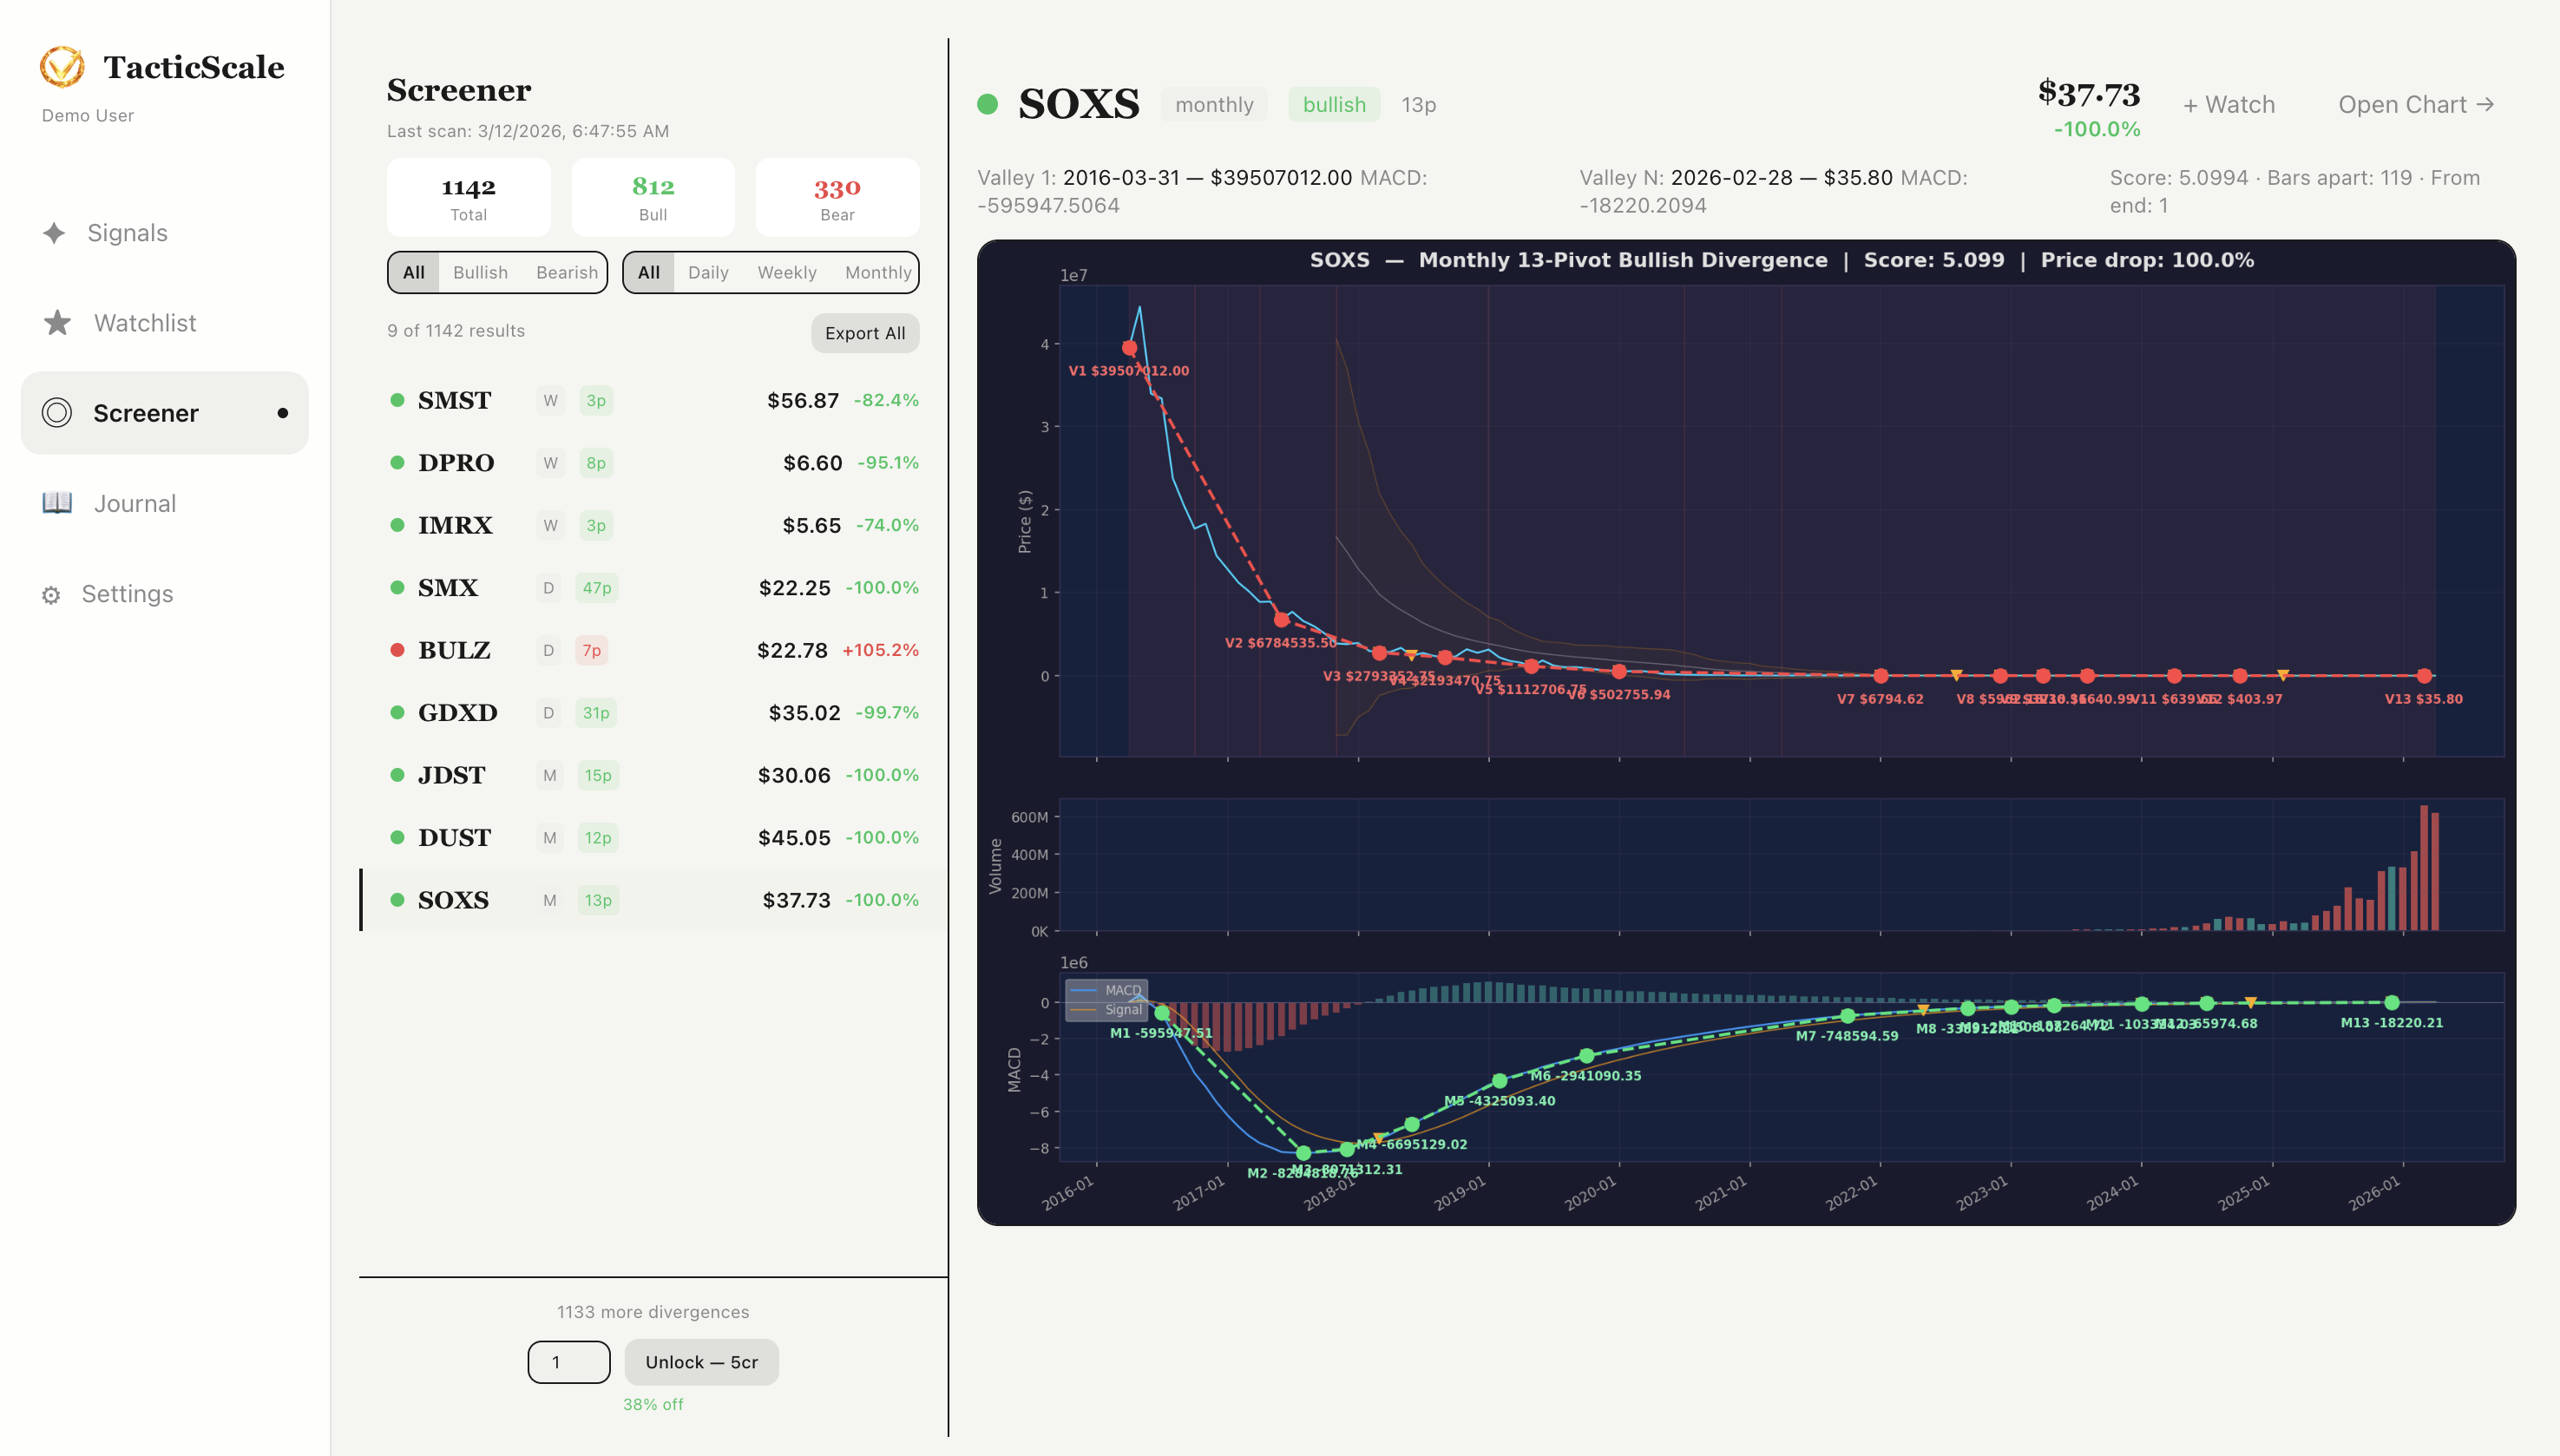
Watchlist & Screener
Each one does what existing tools do — but digested, ranked, and actionable
Find setups you'd miss manually
Thousands of stocks scanned for you daily
See what your emotions are costing you
The difference between raw data and digested insight
TradingView, moomoo, thinkorswim
Powerful tools — but they expect you to do all the work.
TacticScale
Same market data, but digested so you act on insight instead of drowning in noise.
TacticScale is designed for specific types of traders — and honest about who it's not for
Holding for days to weeks. Divergence signals on 4H/Daily/Weekly are your sweet spot. You need to find setups across a broad watchlist, not stare at a single ticker all day.
You know emotions hurt your returns but need data to prove it. MIRROR shows you exactly how many panic sells and FOMO buys you made — and the dollar cost of each one.
You care about more than just price action — news, fundamentals, leadership quality — but don't have hours to read SEC filings and earnings calls. AI digests do it for you.
TacticScale is a web app without execution integration. If you need sub-second order routing and Level II order book depth, this isn't the tool.
If your horizon is 10+ years, divergence signals and multi-timeframe scanning aren't relevant to your strategy.
TacticScale is technical-analysis-first. The AI digests add fundamental context, but the core engine is built around price action and momentum divergence.
From watchlist to insight in 3 steps
Add stocks by symbol or import a list. Manage multiple watchlists, edit positions, and organize tickers with pinning and search.
TacticScale scans every ticker across all 9 timeframes in the background. Signals are ranked by composite score and cached with timeframe-aware TTL.
Click any signal to explore chart views with MACD and volume. Use credits for AI-powered pivot analysis, news digests, and leadership insights. Record your trades in the journal.
Learn how each part of TacticScale works
How TacticScale scans your watchlist across 9 timeframes and ranks signals by composite score.
Interactive candlestick charts with MACD, pivot markers, trade scores, and AI-powered digests.
MIRROR panel detects panic sells and FOMO buys. Trade scoring and position tracking with P&L.
Scan thousands of stocks and ETFs for divergence signals with detailed divergence charts and MACD overlay.
Walk through the full trading loop — find candidates, wait for signals, trade, and review your performance.
Not another SaaS. TacticScale is an AI agent — You focus on trading. AI handles the rest.
Launch TacticScaleWorks in any modern browser — no monthly fee, you only pay for completed tasks. New accounts get free credits to start.
Tell us how you want TacticScale to work for you — click the logo any time inside the app to share your feedback.