Important
TacticScale is an analysis tool, not a trading adviser. It surfaces data and patterns — all trading decisions are yours. The example below is a walkthrough of the tool's workflow, not a recommendation to buy or sell any security. Past patterns do not guarantee future results.
The Full Loop
Most trading tools focus on one part of the process. TacticScale connects the full loop: discover candidates, wait for the right moment, trade, and review what happened. Here's how that looks in practice.
Step 1 Find Candidates with the Screener
You open the Screener page. TacticScale has scanned thousands of stocks and ETFs for divergence signals. You filter for bullish divergences on the daily timeframe — and a ticker catches your eye with a multi-pivot bullish divergence.
The divergence chart shows price making lower lows while MACD momentum is making higher lows — a pattern that has historically preceded reversals. The divergence score helps you gauge how pronounced the pattern is compared to other results.
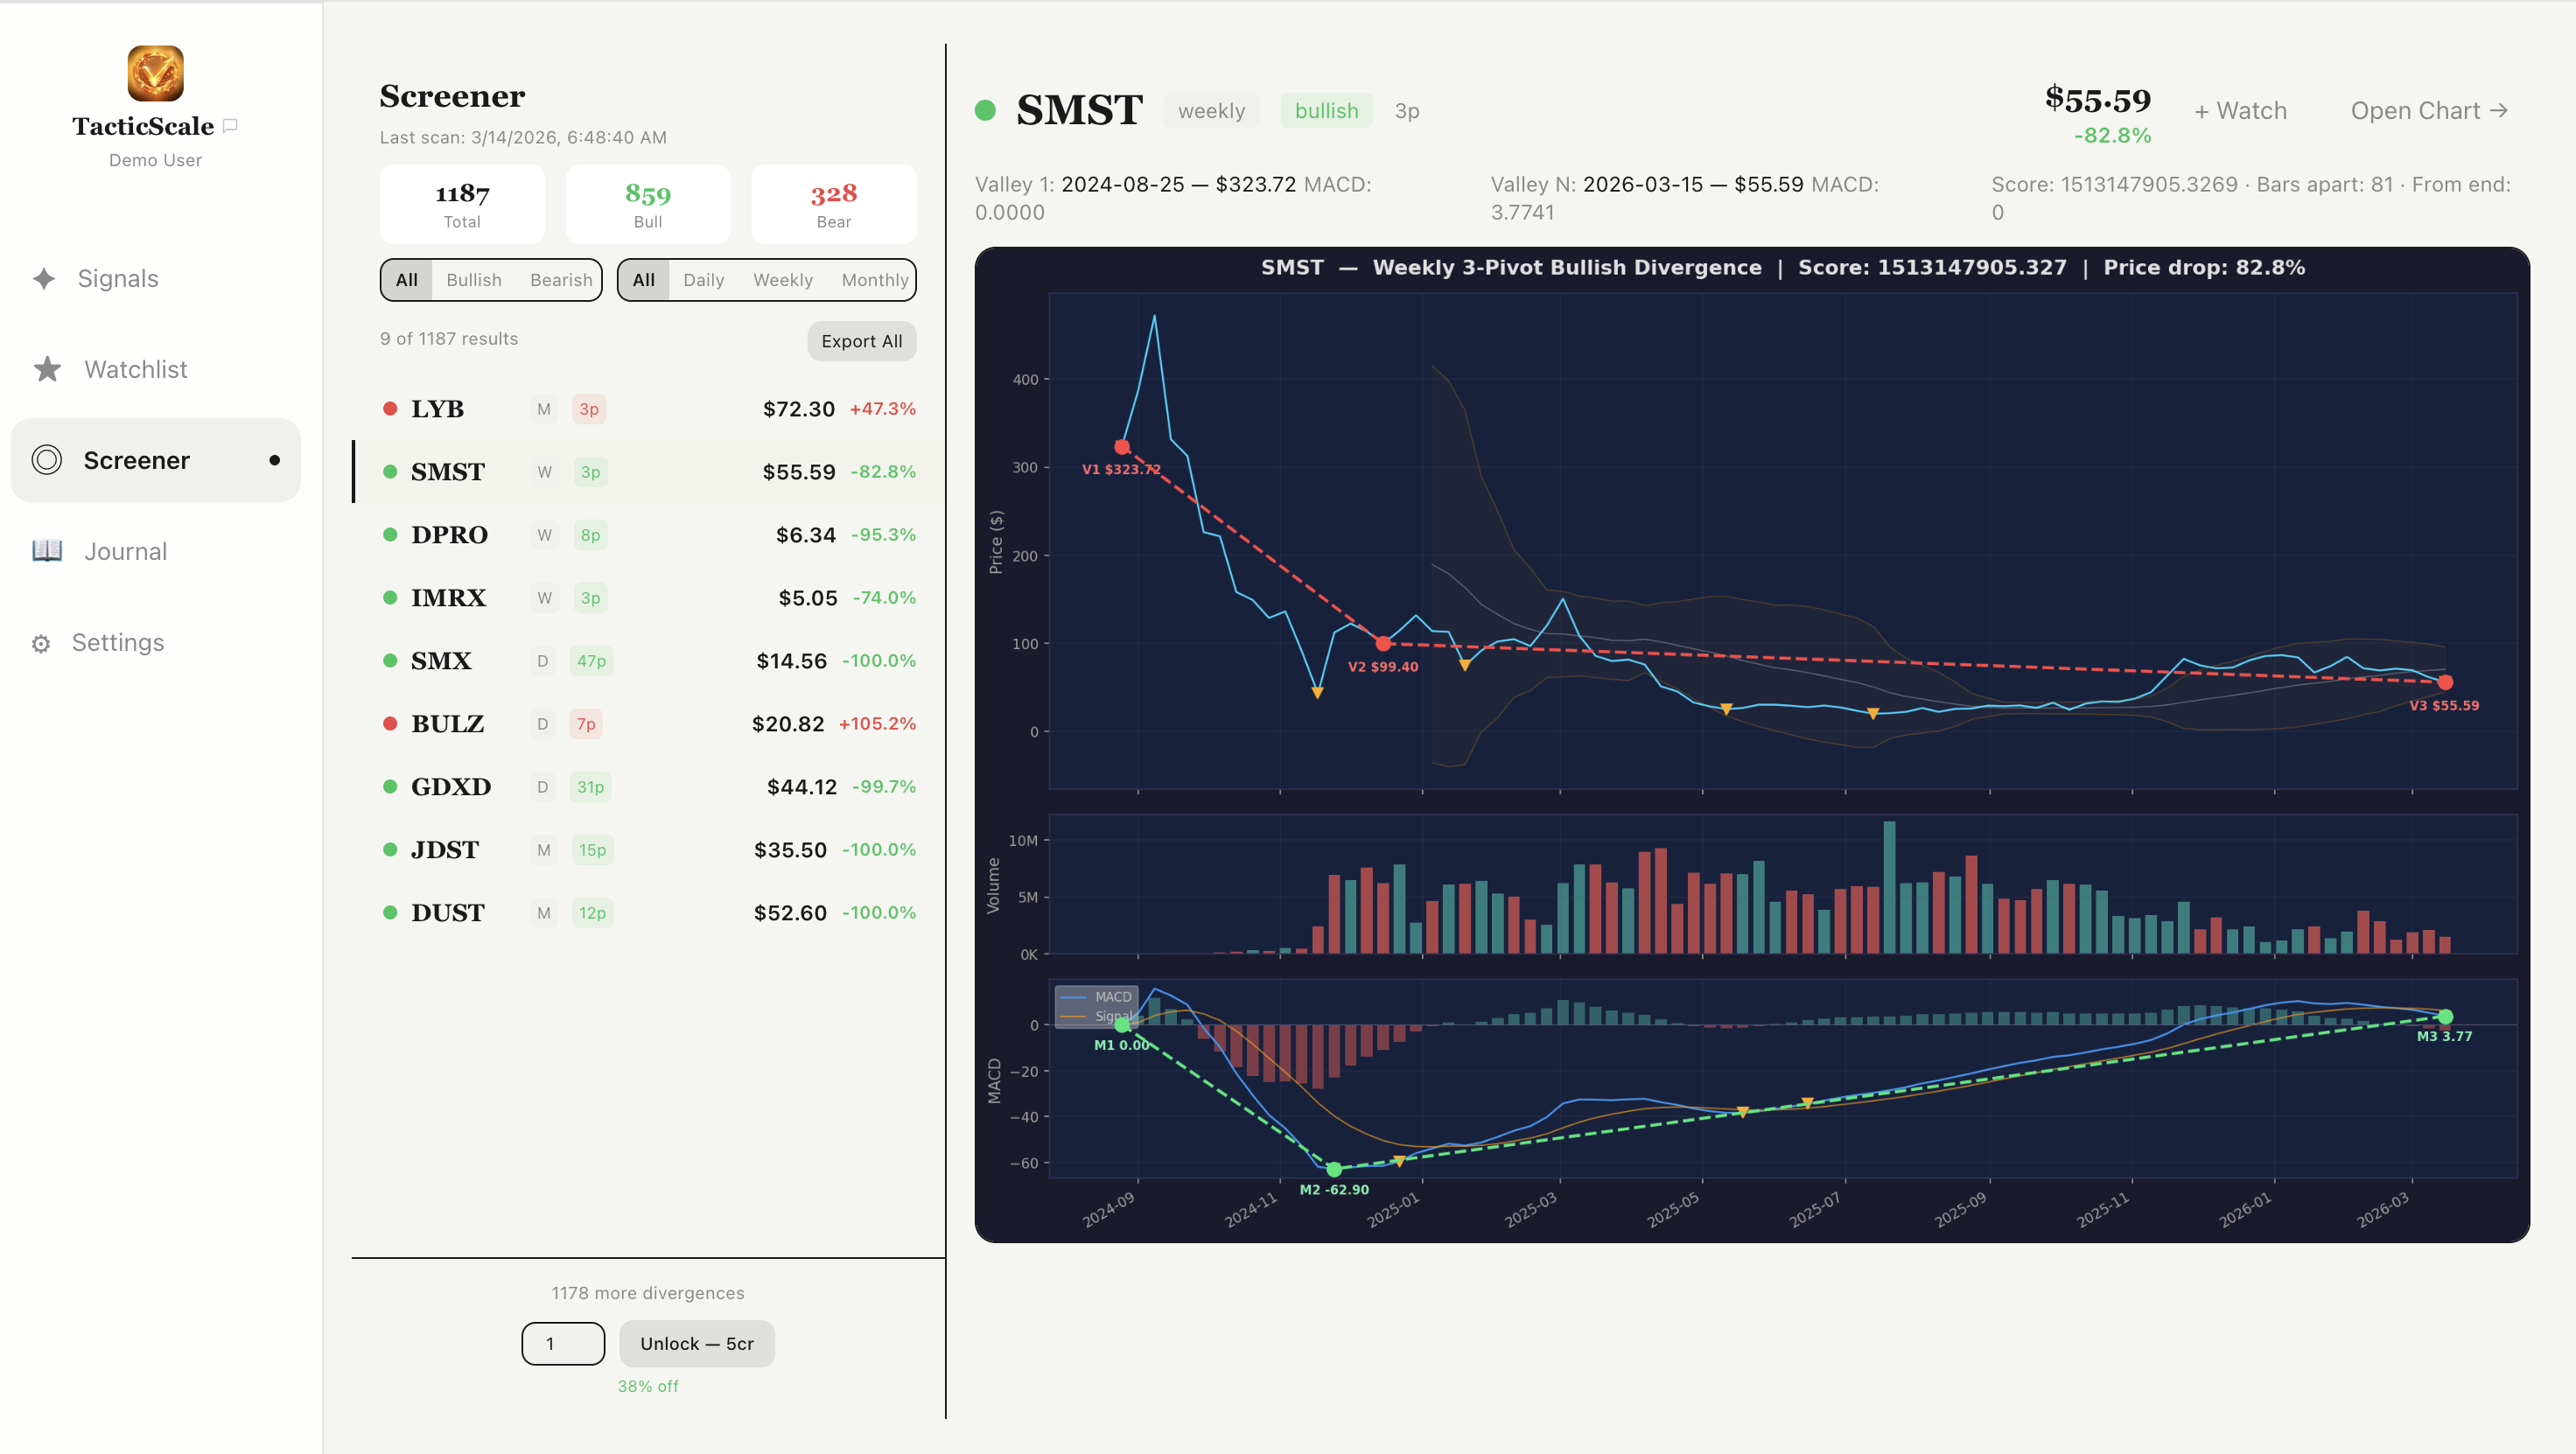
You click "Open Chart" to examine the ticker more closely. The candlestick chart confirms the setup — price has pulled back significantly, and the divergence aligns with a support zone visible on the weekly chart.
Step 2 Add to Your Watchlist
The setup looks interesting, but you're not ready to act yet. You add the ticker to your watchlist so TacticScale will include it in every signal scan going forward.
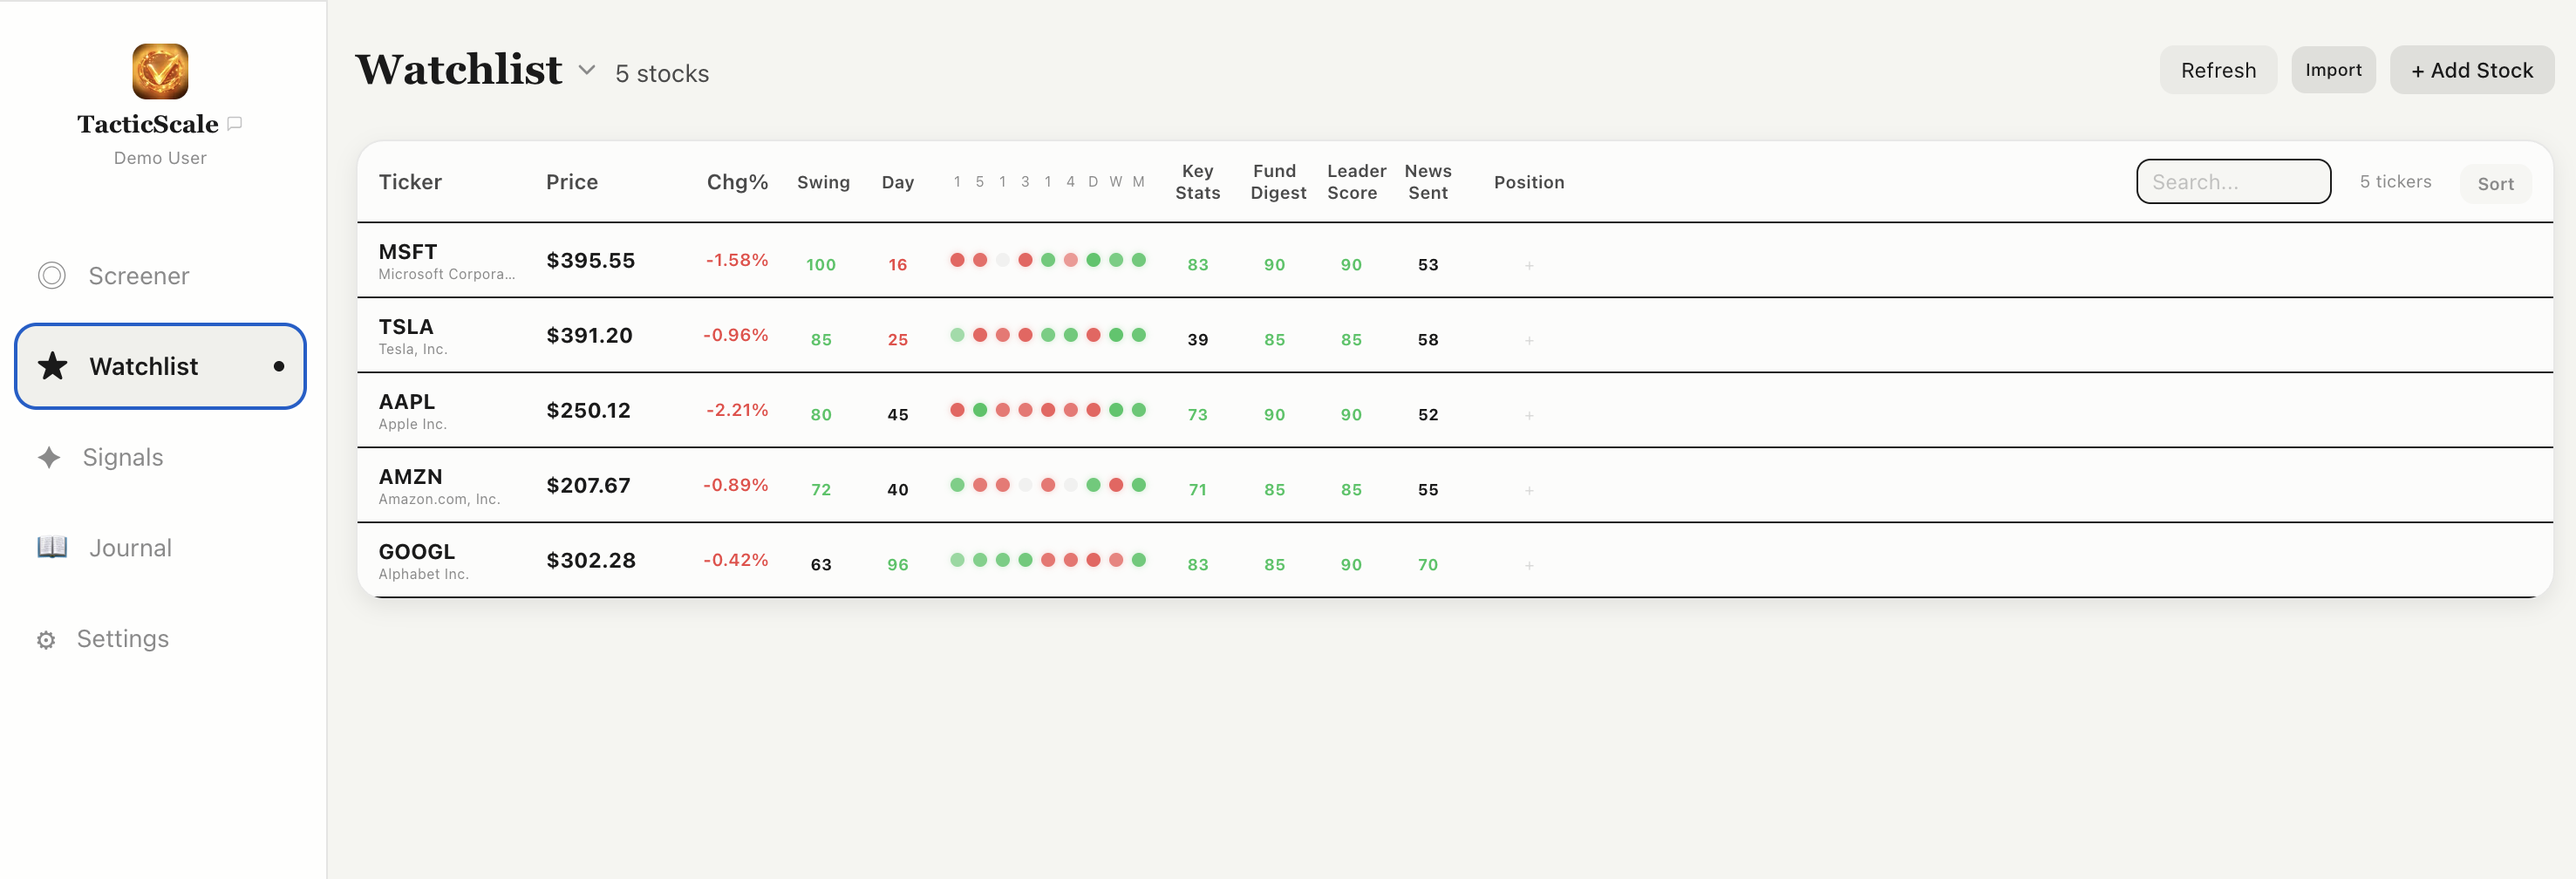
Now it's tracked alongside your other tickers. Every time the scanner runs, it checks across all 9 timeframes — from 1-minute to monthly — and surfaces any new signals.
Step 3 Wait for the Right Signal
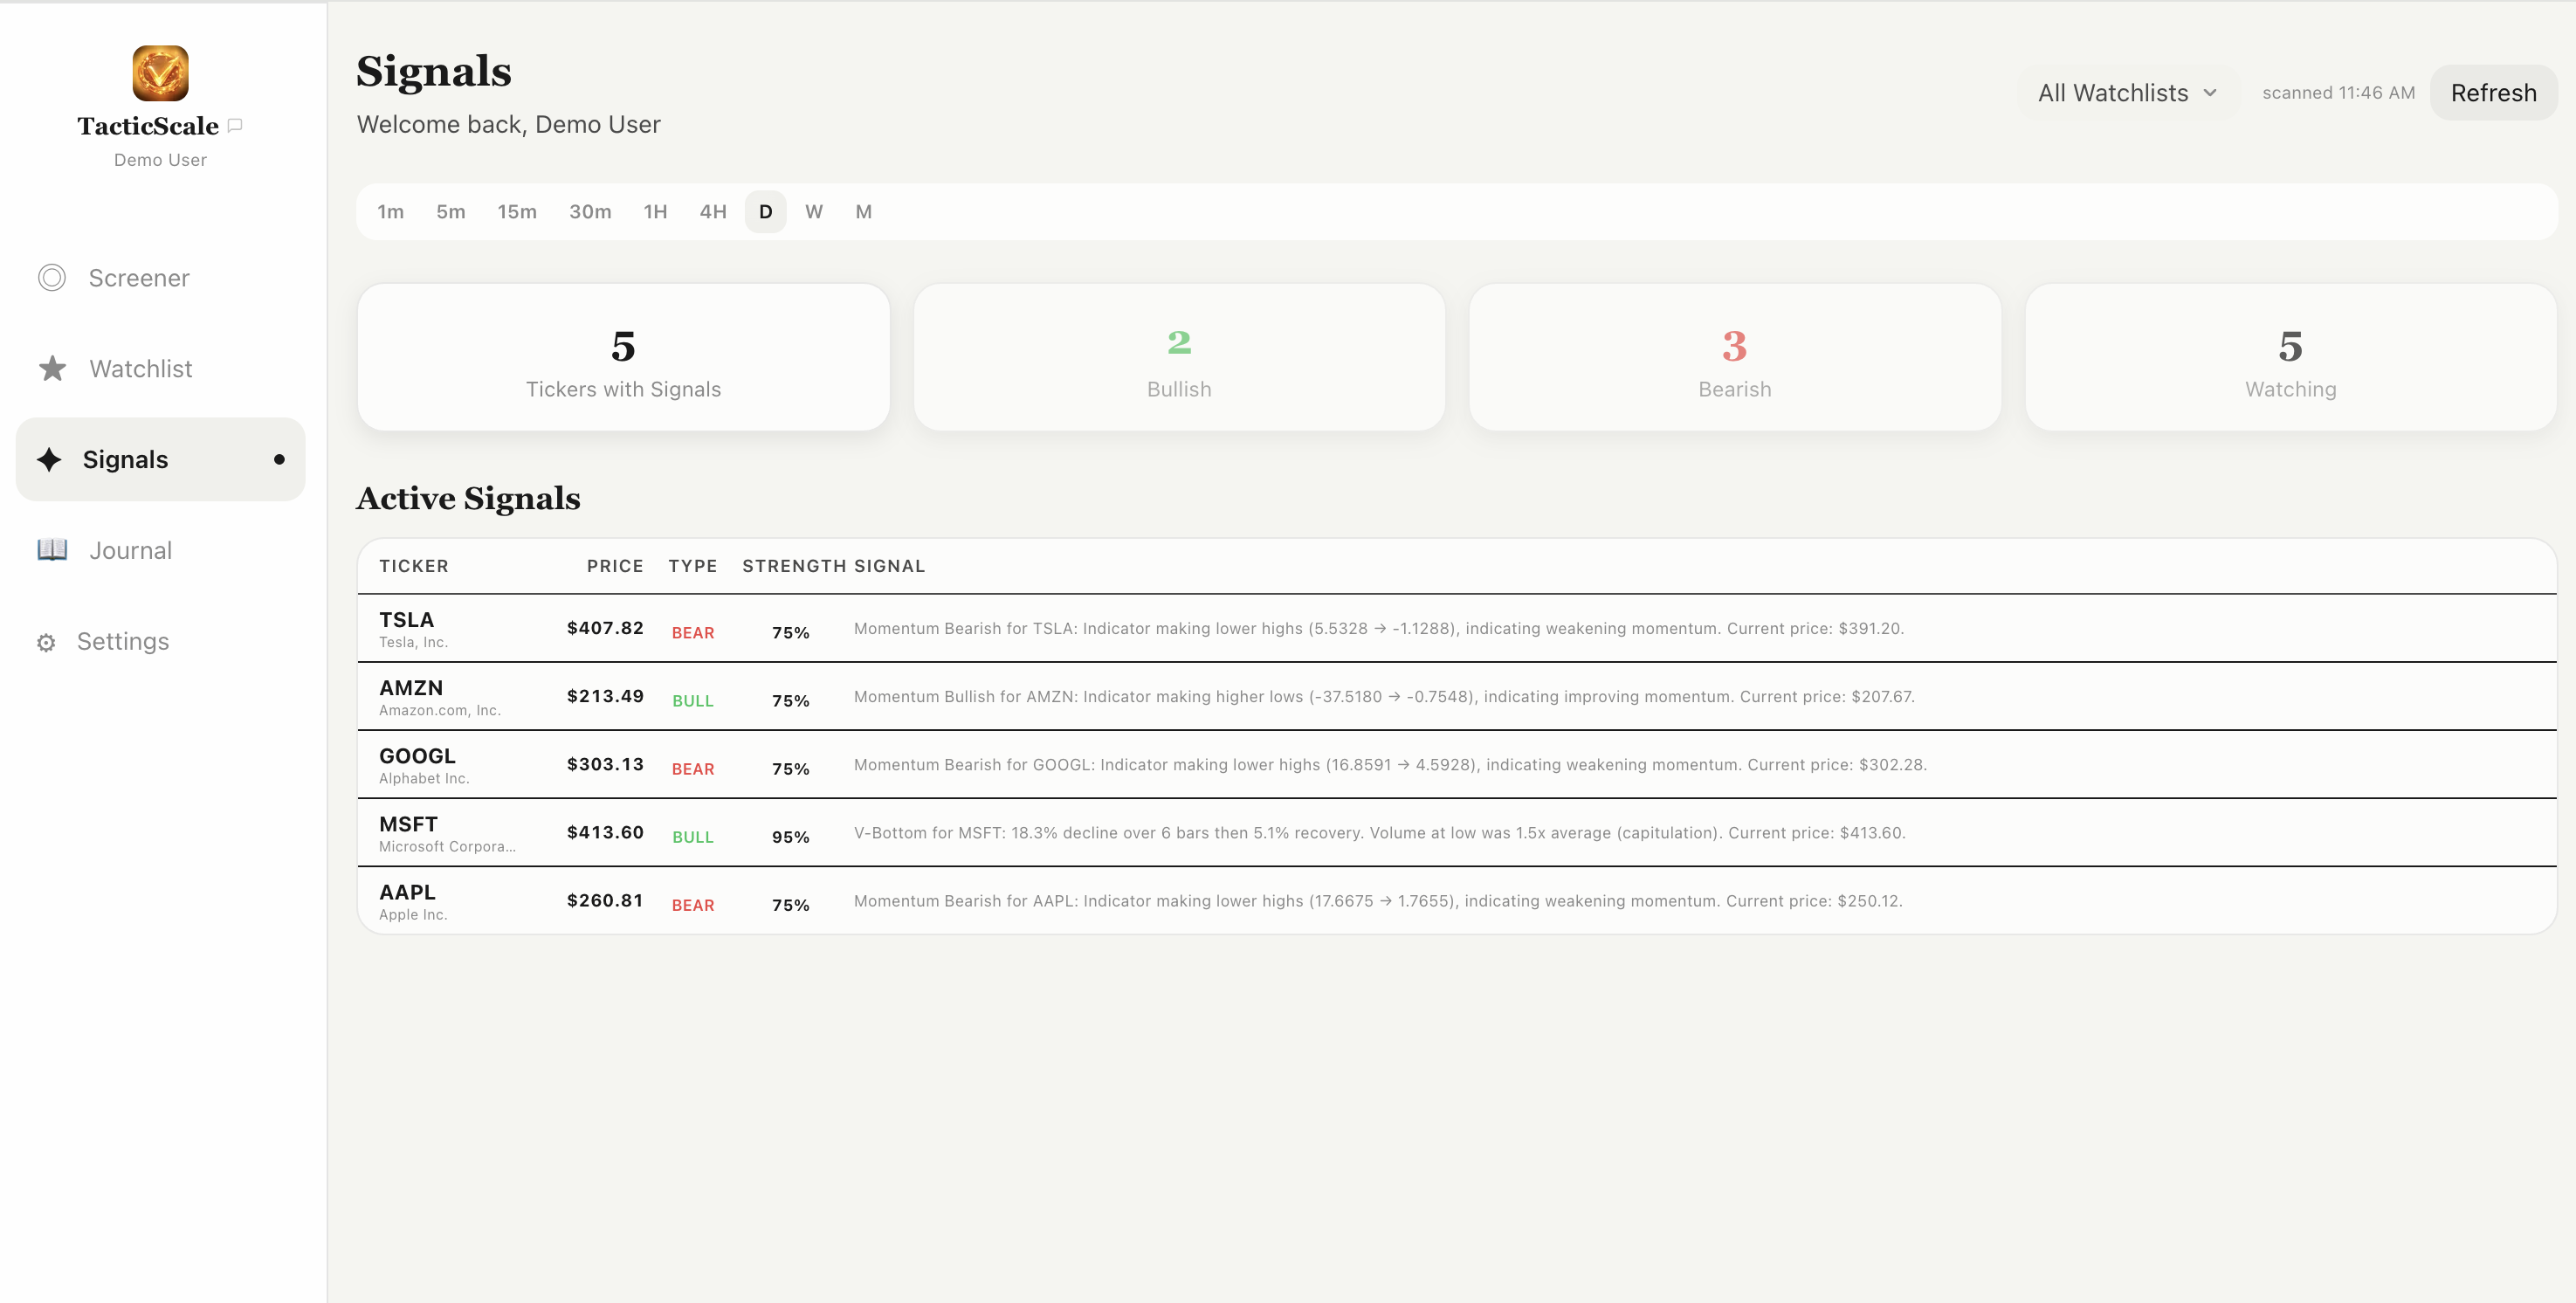
Days later, you open the Signals Dashboard. Your ticker has a new entry in the Active Signals list — a bullish momentum signal on the 4-hour timeframe with a high strength score. The signal description explains that it's making higher lows with increasing momentum, confirming the earlier divergence pattern you spotted in the Screener.
Signals are data, not instructions
A high-strength signal means the pattern is pronounced — it does not mean the stock will go up. You still need to consider the broader market context, your risk tolerance, position sizing, and your own analysis before deciding to trade.
Step 4 Make Your Trades
Based on your own analysis of the signal data, chart patterns, and market conditions, you decide to take a position. You execute your trades through your broker — TacticScale does not execute trades or connect to brokers.
In this example, let's say you make a series of trades over the next two weeks — an initial entry after the signal confirms, a second buy on a pullback to support, and a sell taking profit after a strong move higher.
You import these trade records into TacticScale's Journal page via CSV from your broker, or enter them manually.
Step 5 Review and Improve with the Journal
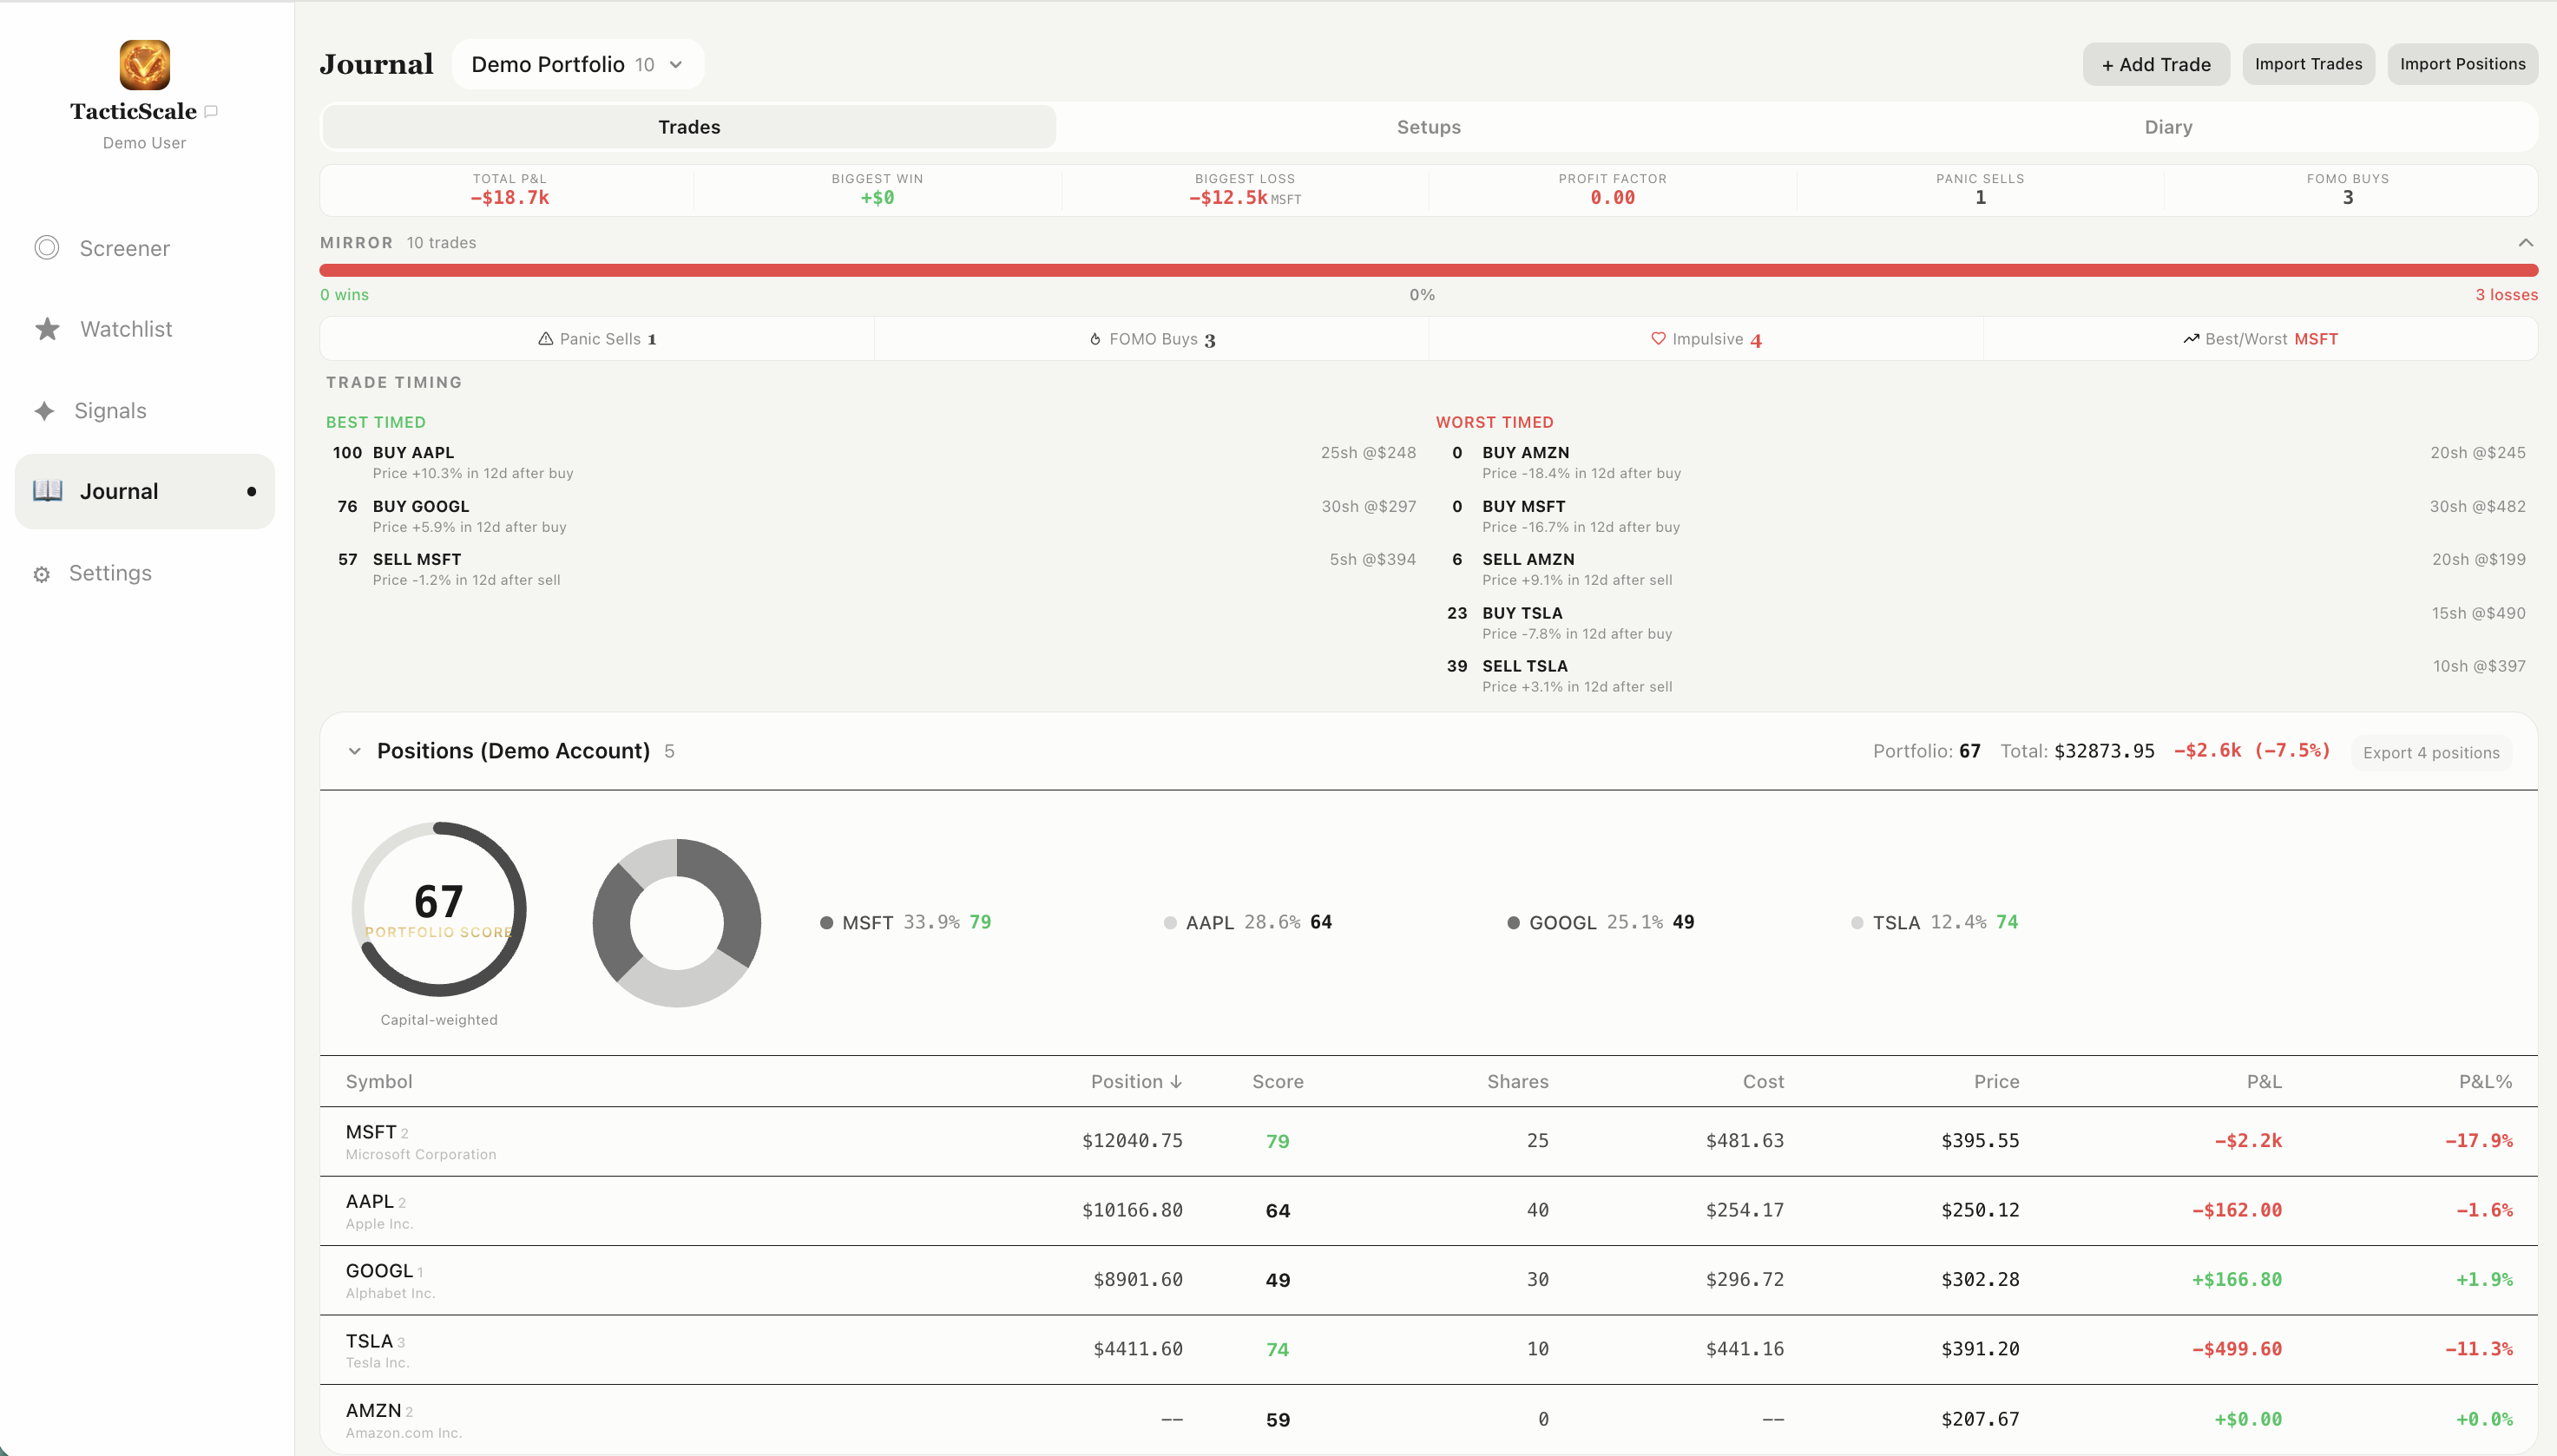
This is where TacticScale's value compounds. You open the Journal page and click into your position. The chart loads in trade review mode — your buy and sell markers are overlaid on the candlestick chart so you can see exactly where you entered and exited relative to the price action.
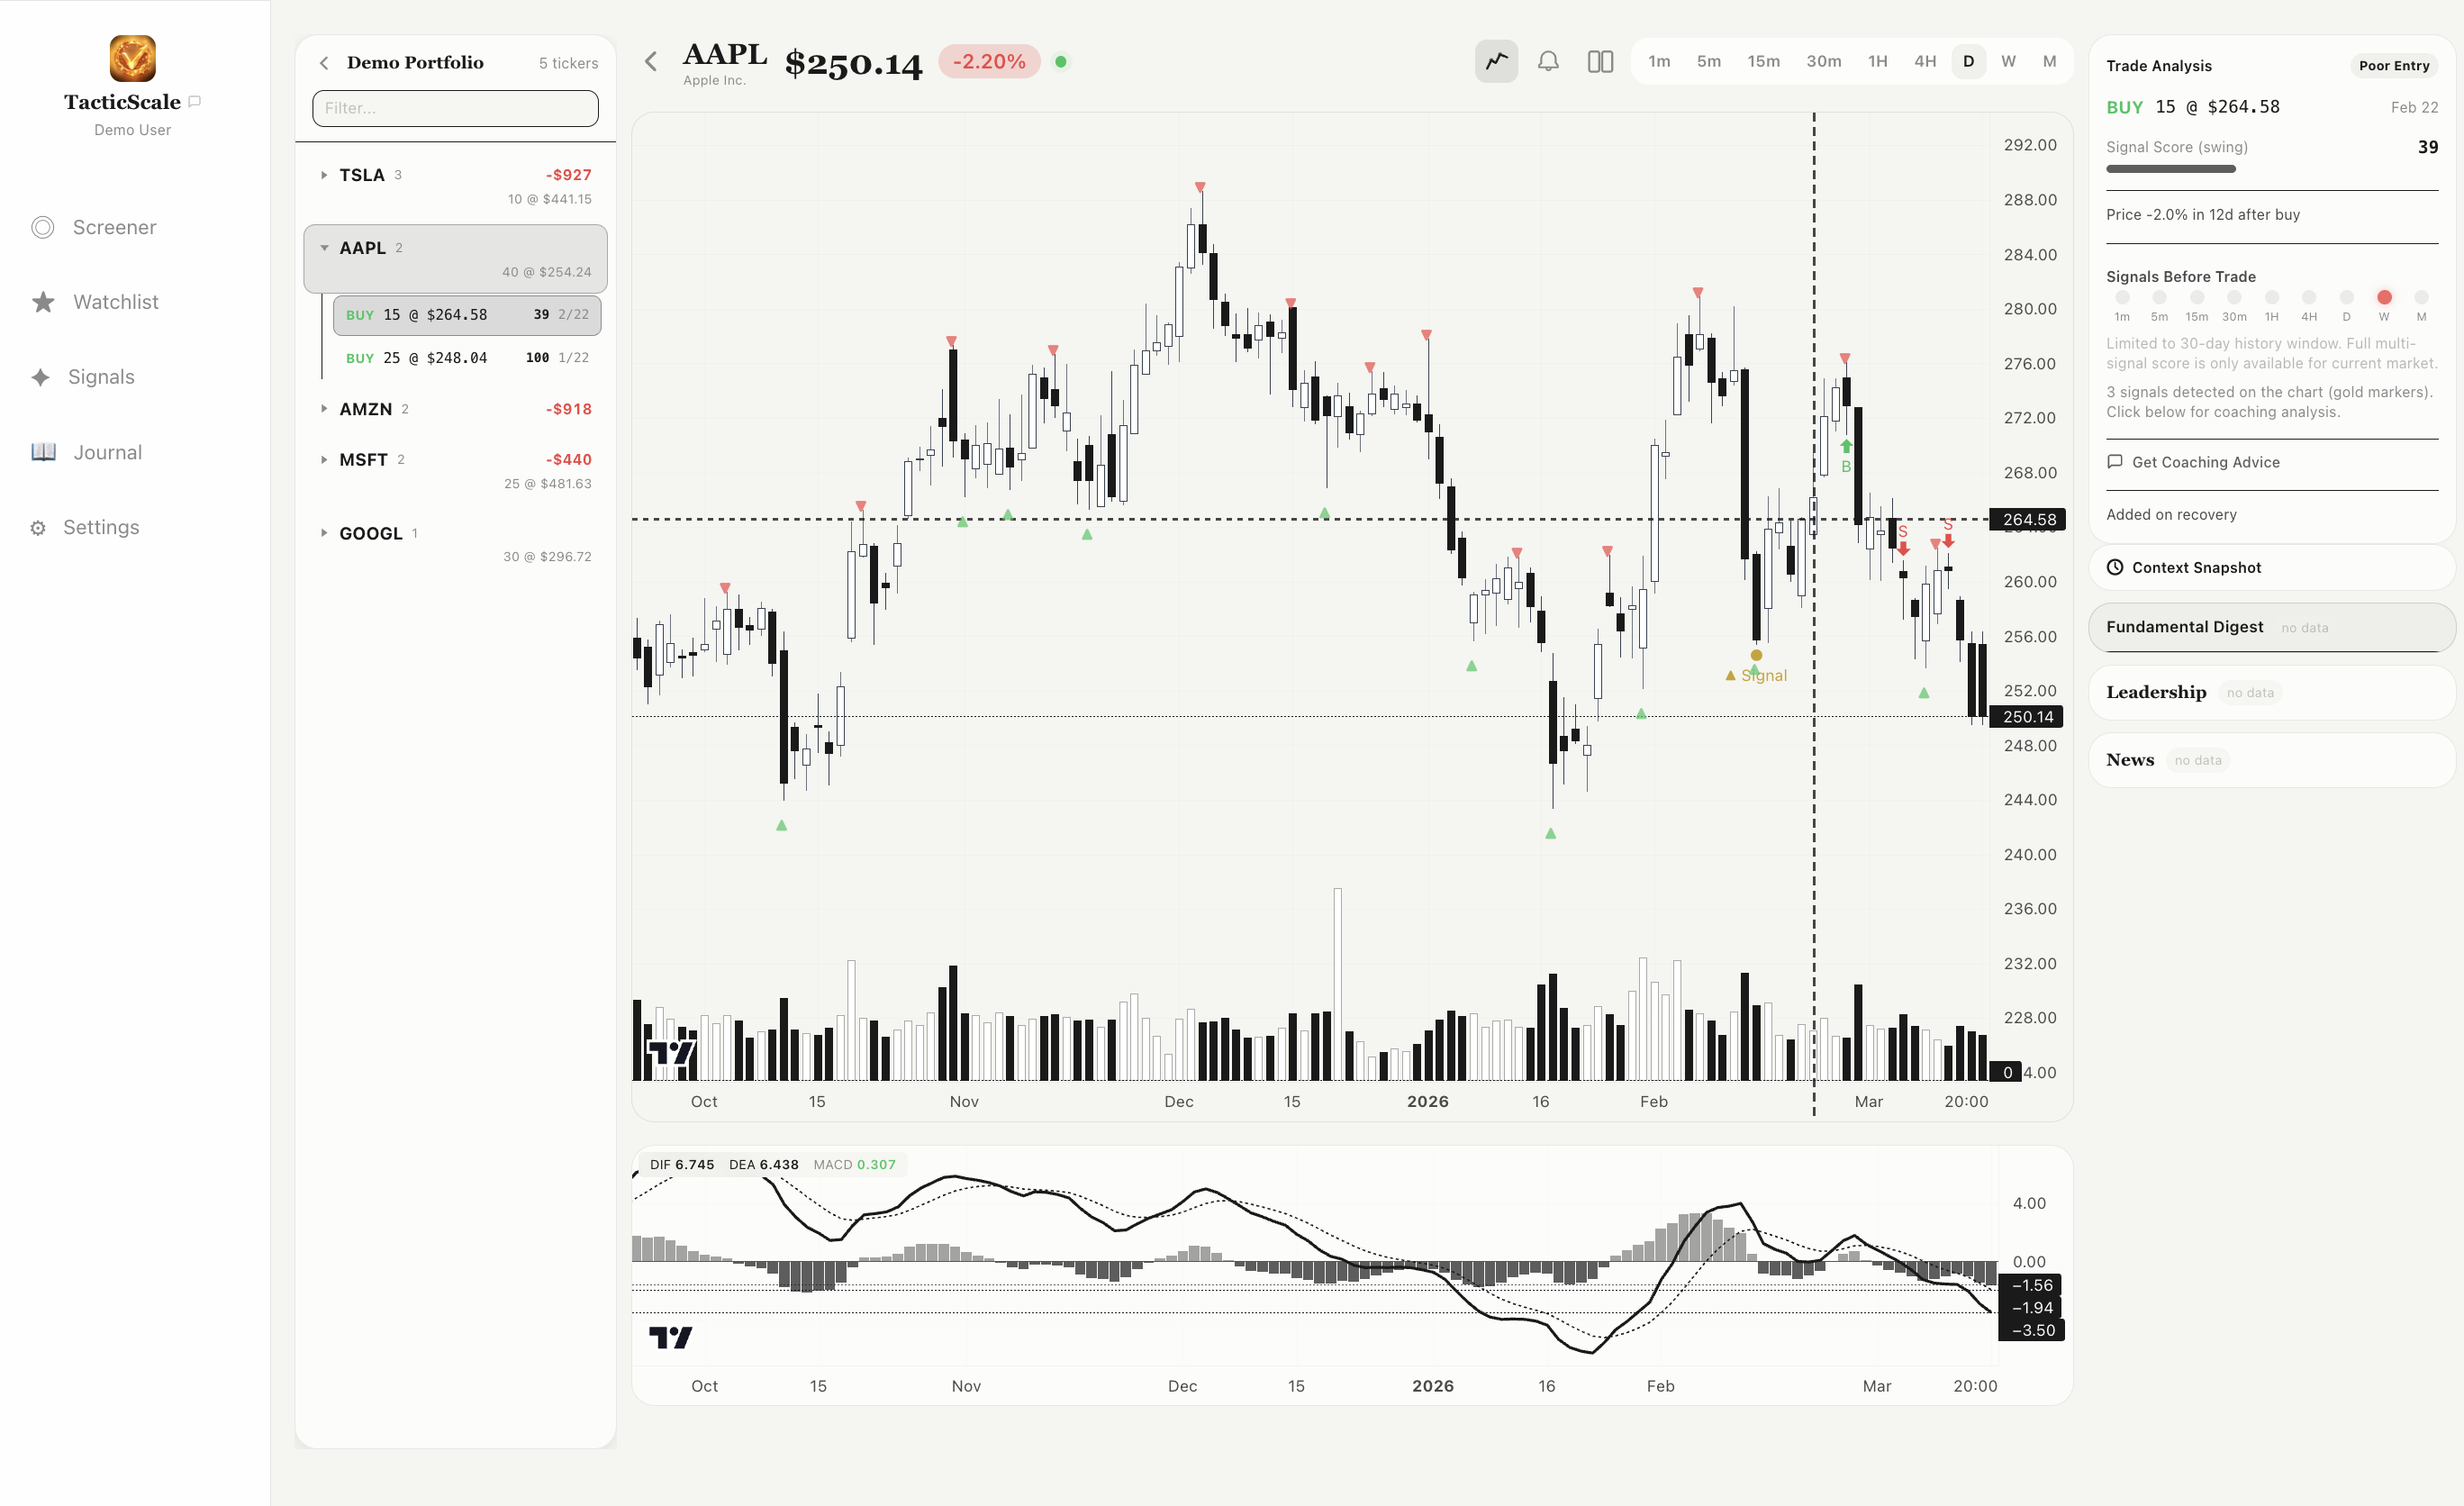
The MIRROR panel on the left analyzes your trading behavior:
- Trade scores — each trade is scored based on timing relative to local highs and lows
- Panic sell detection — did you sell near a local bottom out of fear?
- FOMO buy detection — did you buy near a local top chasing momentum?
- Position P&L — your total profit or loss for the position, with per-trade breakdown
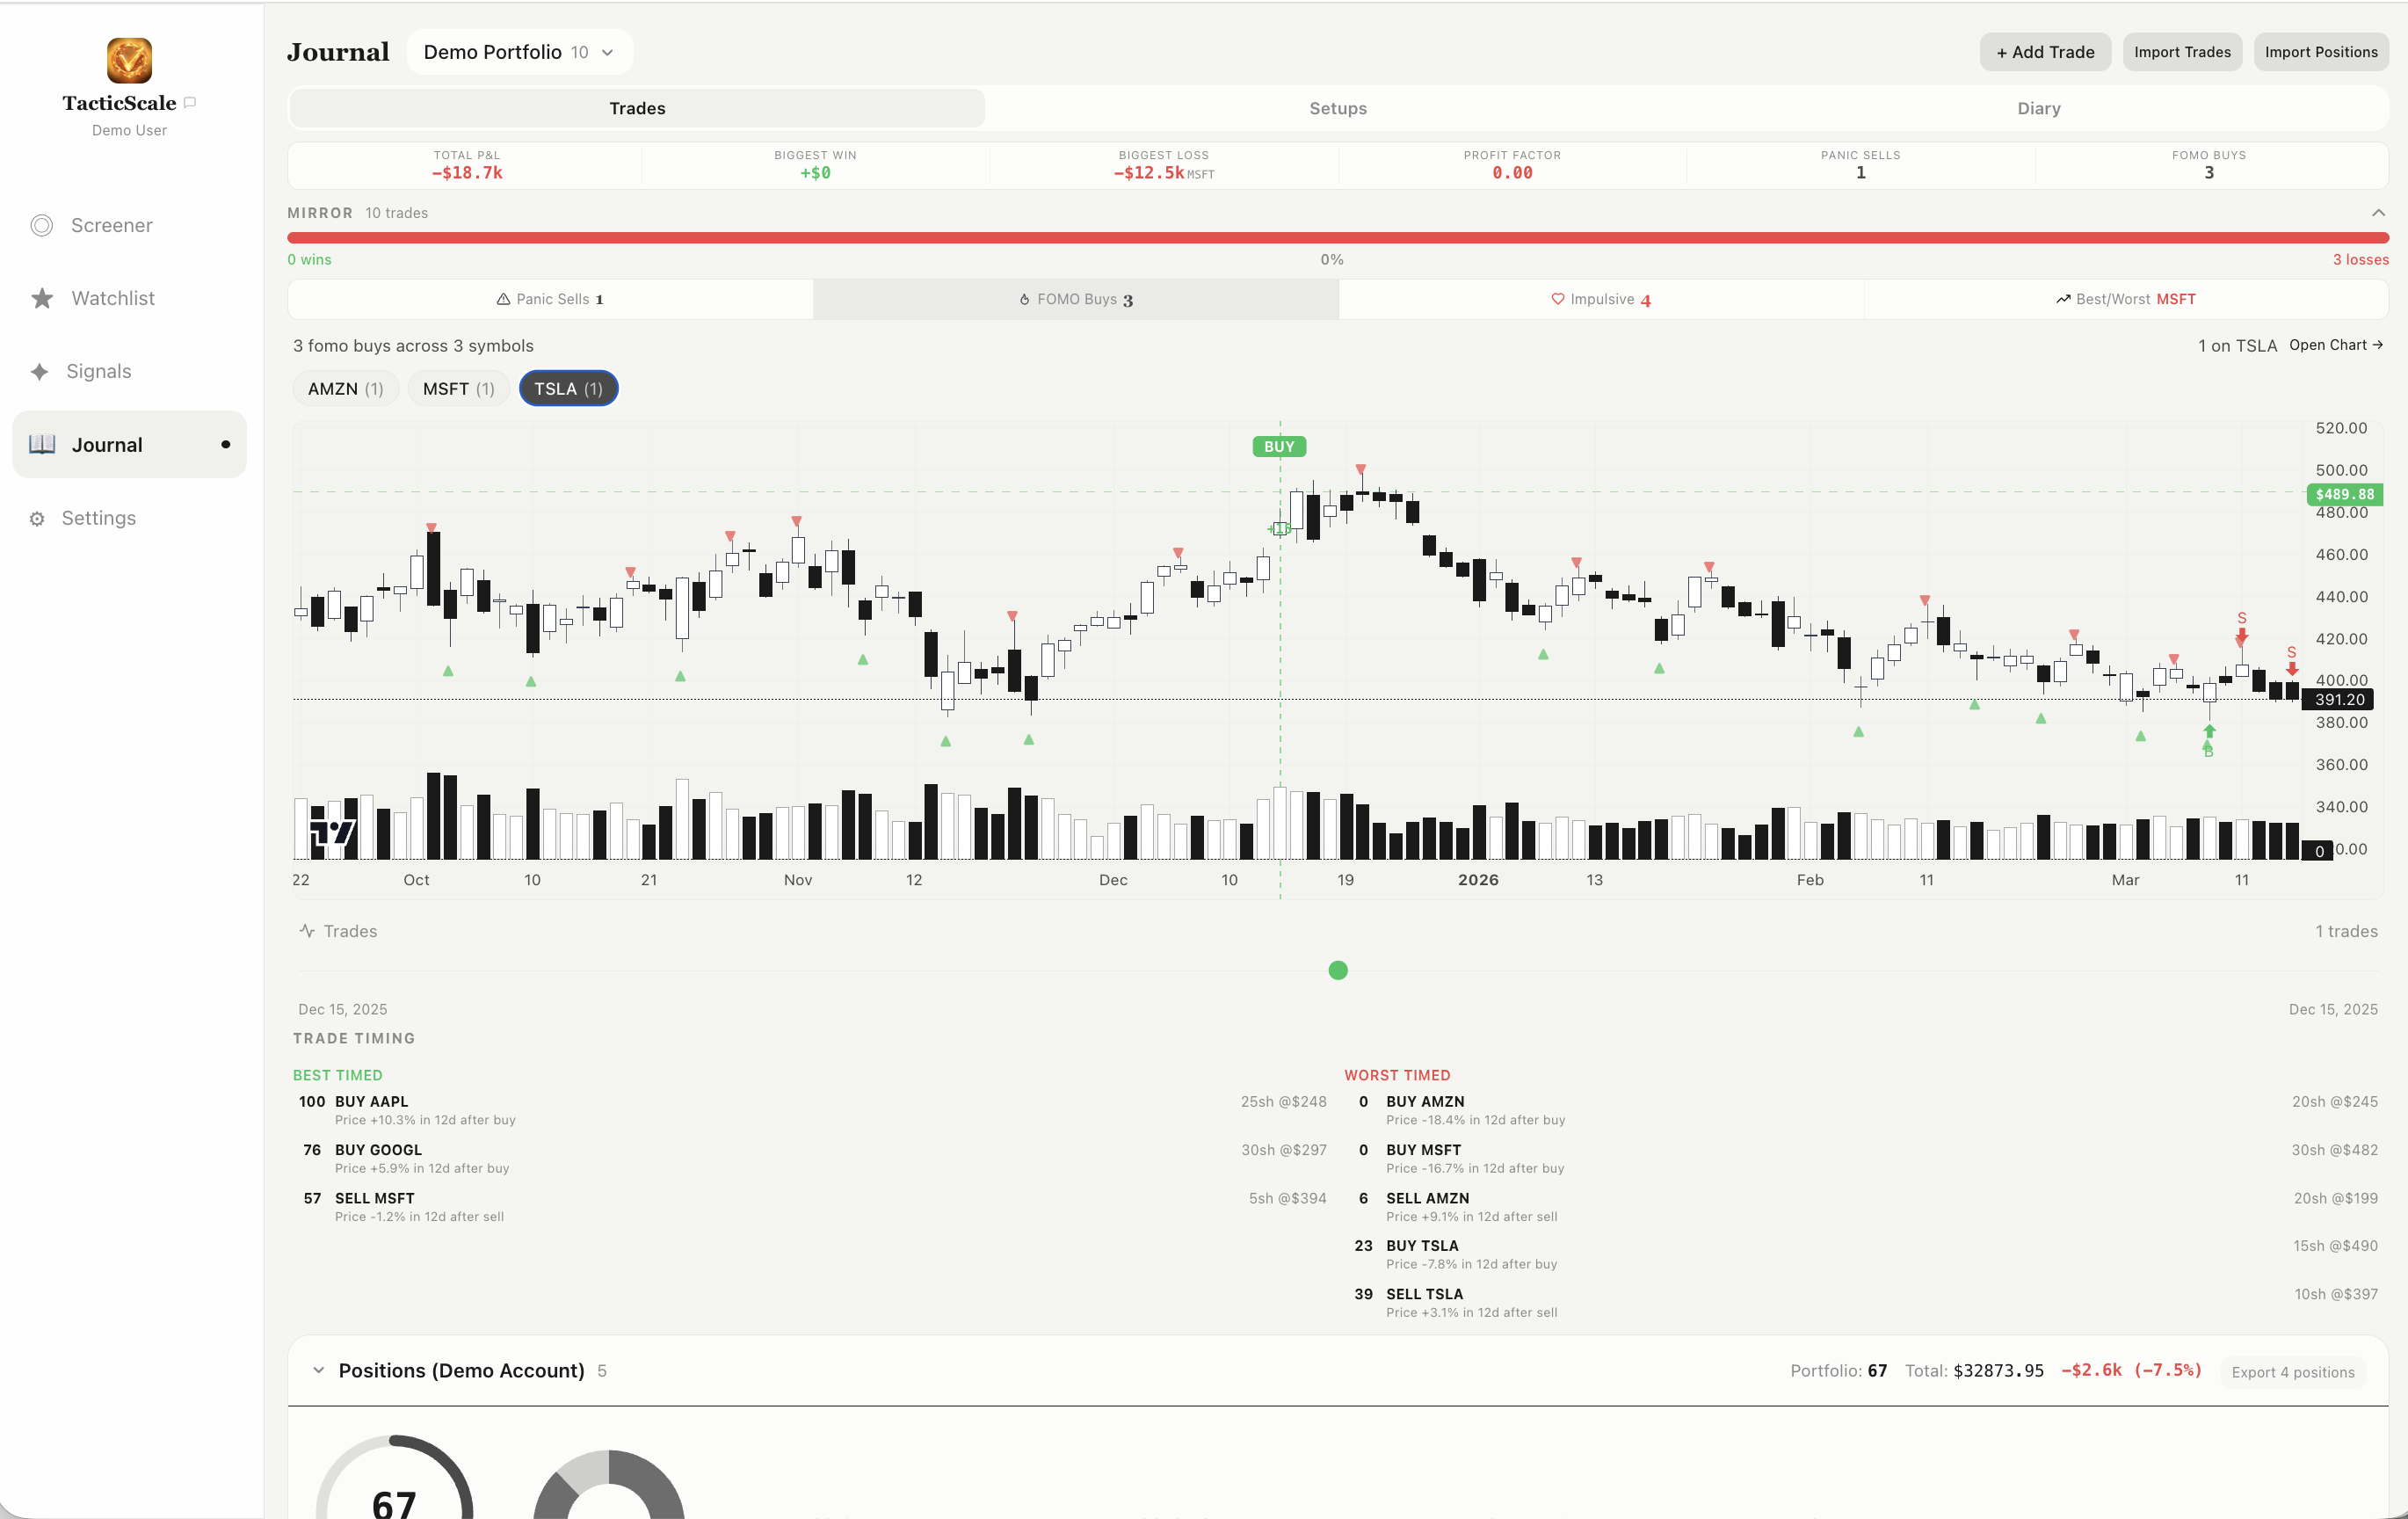
In this example, the MIRROR panel detected 3 FOMO buys across 3 symbols — AMZN, MSFT, and TSLA. With TSLA selected, the chart tells the story: the buy marker sits near a local high. You chased the price up on momentum and bought near the top — a textbook FOMO buy. The MIRROR panel catches this pattern automatically, so you don't have to rely on memory or gut feeling. Over time, seeing these flags across your trades reveals whether FOMO is a recurring habit costing you money.
The pattern you can't see without data
Over dozens of trades, the Journal reveals your behavioral patterns. Maybe you consistently buy too early, or hold too long, or panic sell at the worst moment. These insights are invisible without systematic tracking — and they're often where the biggest improvements in trading performance come from.
The Complete Loop
That's the full workflow:
- Screener — discover candidates you'd never find manually
- Watchlist — track them so no signal gets missed
- Signals — wait for the data to confirm a setup
- Trade — make your own decision and execute through your broker
- Journal — review what happened and find patterns in your behavior
Each step feeds the next. The Screener fills your Watchlist. The Watchlist feeds the Signals scanner. Your trades go into the Journal. And the Journal's insights make you a sharper trader the next time you open the Screener.
Your decisions, your results
TacticScale provides analysis tools — signal scanning, divergence detection, and behavioral trade review. It does not provide trading advice, recommendations, or guarantees. Every trade decision is made by you, the trader. Always do your own research and consider your risk tolerance before trading.
Built for Winning Traders
Not another SaaS. TacticScale is an AI agent — you focus on trading, AI handles the rest.
Launch TacticScale