More Than a Trade Log
Most trade journals are just spreadsheets. TacticScale's Journal page goes further — it analyzes your trading behavior to surface patterns you might not see on your own. The MIRROR panel is the centerpiece: it looks at your actual trades and flags the ones driven by emotion rather than strategy.
Getting Your Trades In
There are two ways to populate your journal:
- CSV Import — click "Positions CSV" in the top-right to import trades exported from your broker. TacticScale auto-creates position holders grouped by symbol.
- Manual Entry — click "+ Add Trade" to log individual trades with symbol, date, price, shares, and direction.
You can manage multiple trade lists (e.g., one per broker account or strategy) using the dropdown at the top.
Summary Statistics
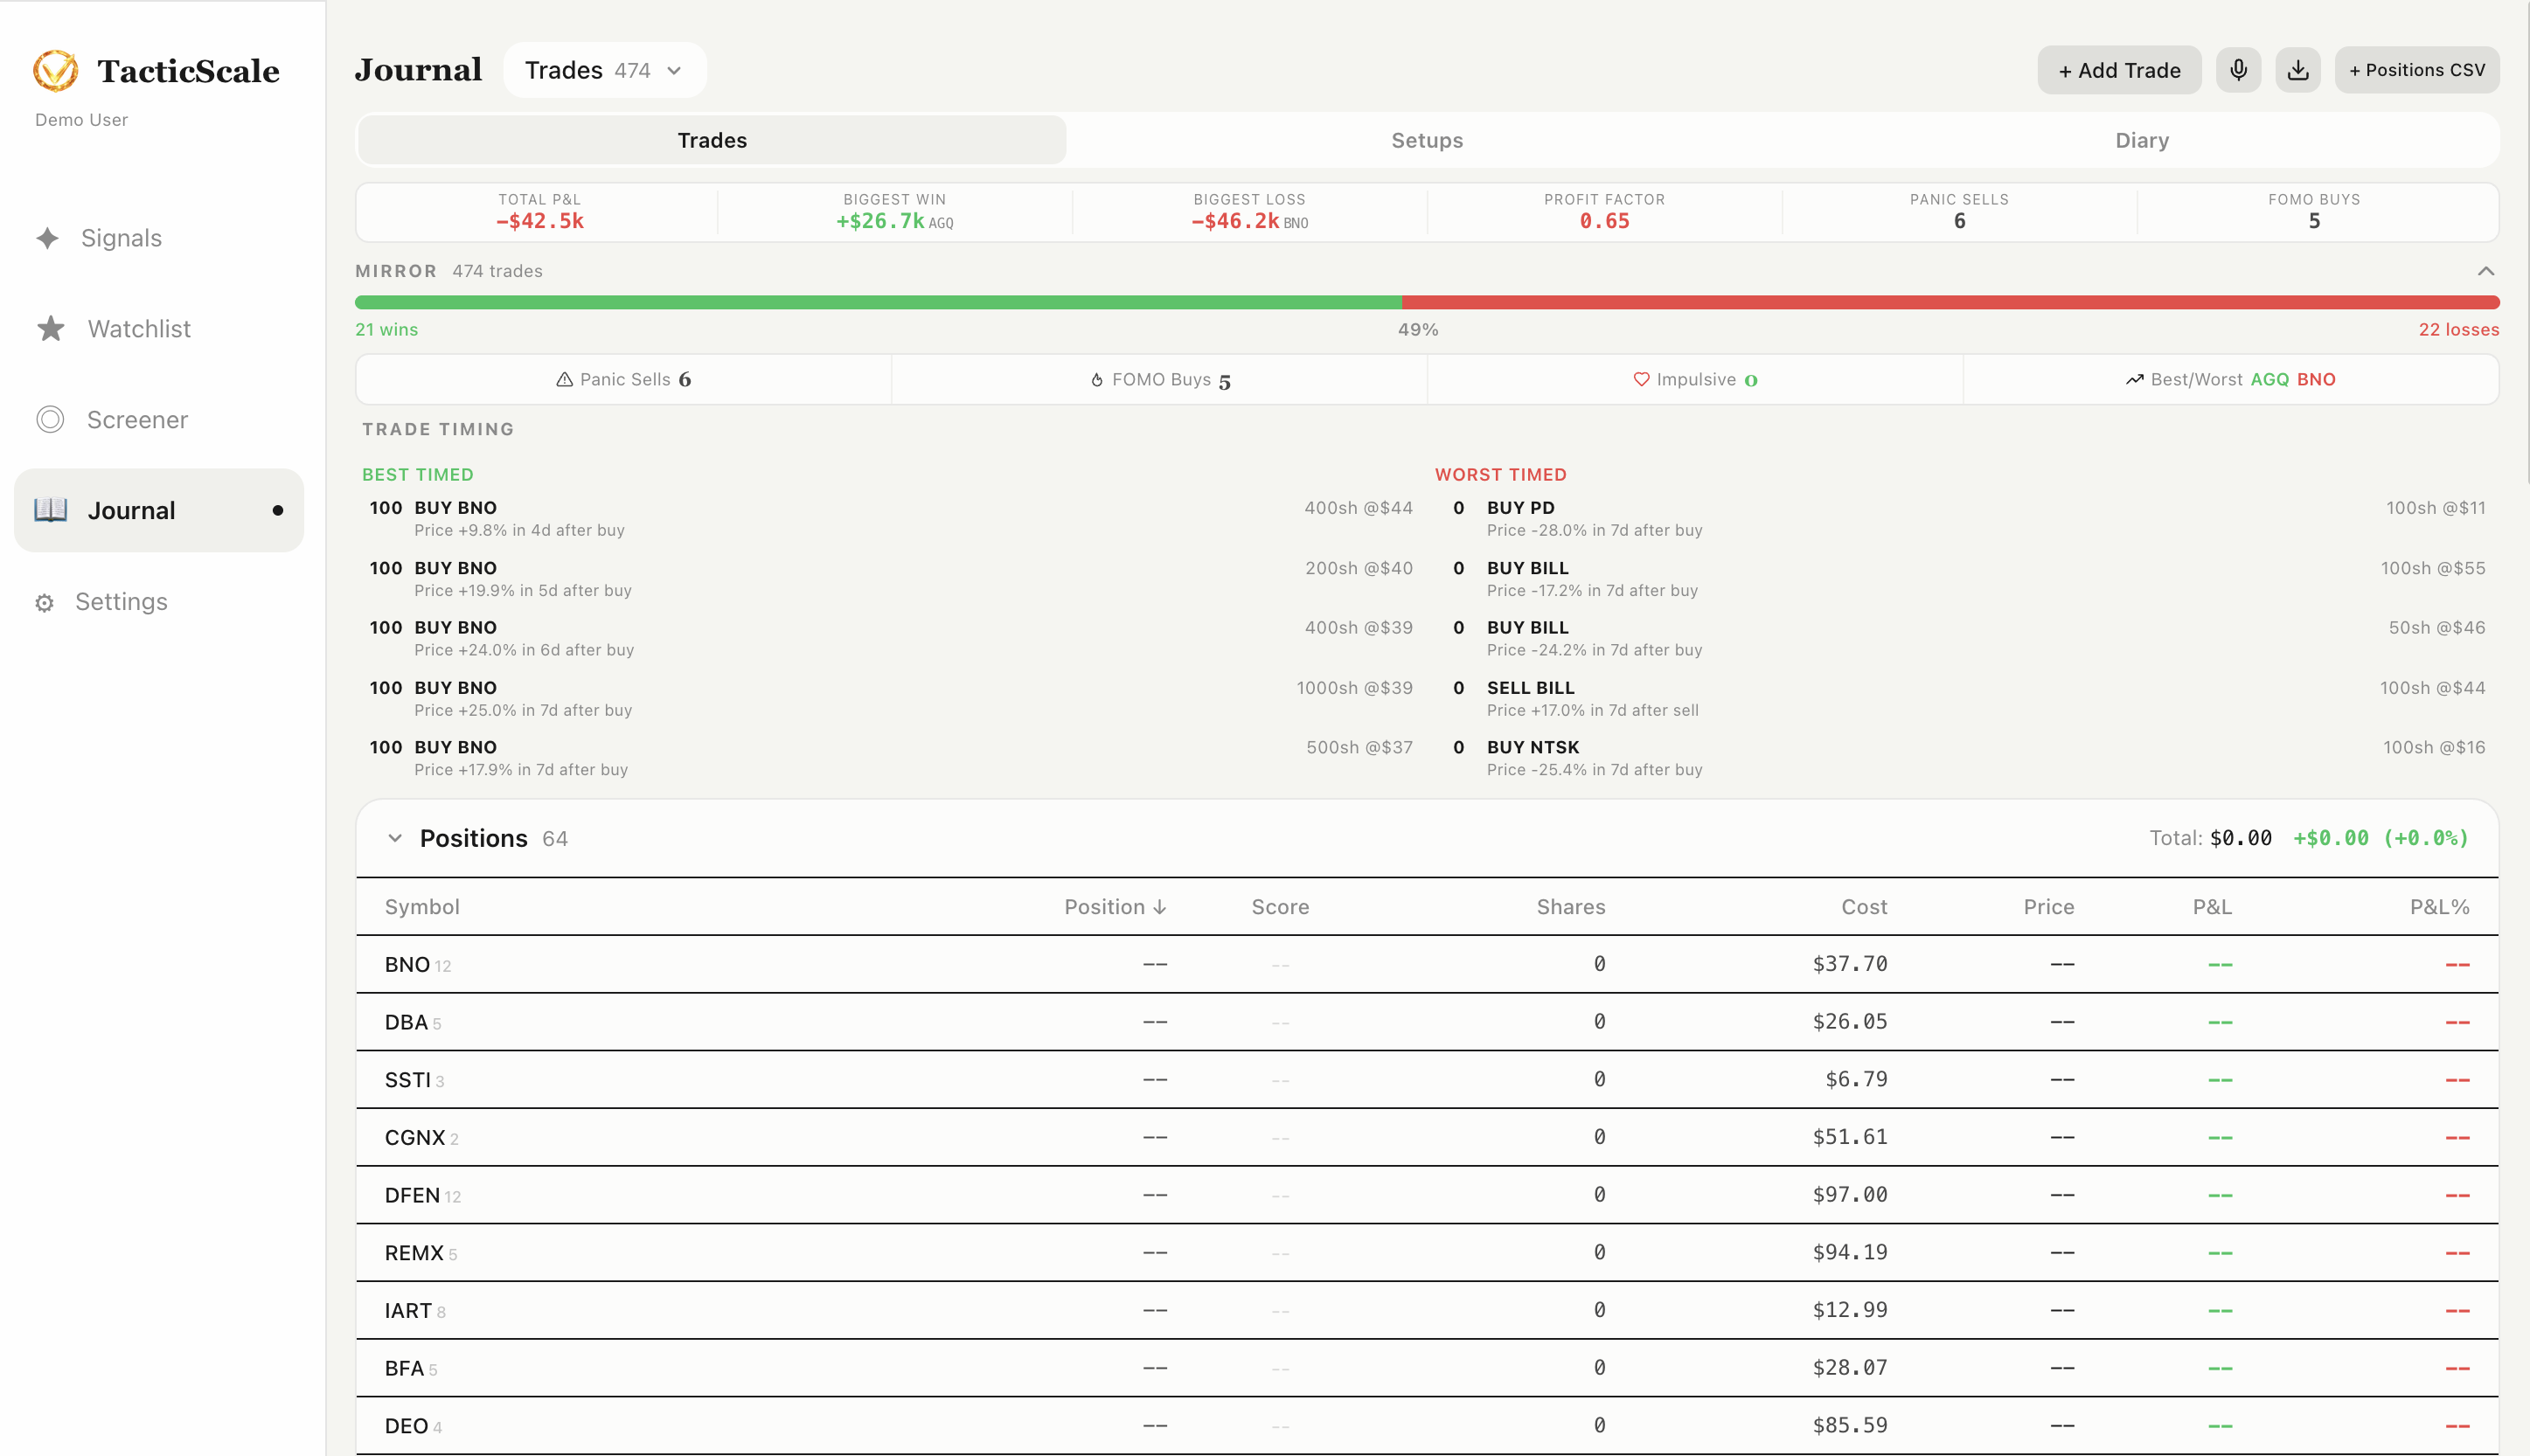
At the top of the Trades tab, summary cards show your key metrics at a glance:
- Total P&L — your overall profit or loss across all trades
- Biggest Win — your single best trade by dollar amount
- Biggest Loss — your single worst trade
- Profit Factor — ratio of total gains to total losses (above 1.0 means net profitable)
- Panic Sells — count of trades flagged as panic-driven exits
- FOMO Buys — count of trades flagged as fear-of-missing-out entries
The MIRROR Panel
MIRROR is TacticScale's behavioral analysis engine. It examines each of your trades and classifies them:
- Win/Loss Bar — a visual bar showing your win rate (e.g., 21 wins at 49%, 22 losses), giving you an honest snapshot of your overall performance
- Panic Sells — trades where you sold at a loss shortly before the price recovered. These flag emotional exits.
- FOMO Buys — trades where you bought after a sharp run-up, only to see the price pull back. These flag chasing behavior.
- Impulsive Trades — trades executed without adequate setup or outside your normal patterns
Why MIRROR Matters
Most traders lose money not because their analysis is wrong, but because emotions override their plan. MIRROR puts a number on how often this happens to you. Seeing "Panic Sells: 6" in hard numbers is more actionable than a vague feeling that you "might be selling too early." Over time, watching this number decrease is one of the most meaningful improvements you can make.
Trade Timing: Best and Worst
Below the MIRROR summary, two columns show your best-timed and worst-timed trades side by side. Each entry shows the trade details, the price you entered at, and what happened afterward — how much the stock moved in the days following your trade. This helps you understand not just what you bought, but whether your timing was right.
Positions Table
The bottom section shows all your positions in a table format:
- Symbol — the stock ticker, clickable to open its chart
- Position — long or short indicator
- Score — a per-position performance score
- Shares — current share count
- Cost — your average cost basis
- Price — current market price
- P&L / P&L% — unrealized profit or loss in dollars and percentage
Click any position's symbol to open its chart in trade review mode, where your entry and exit points are overlaid on the candlestick chart for visual review.
Tabs: Trades, Setups, Diary
The Journal page has three tabs:
- Trades — the main view shown above with MIRROR analysis and positions
- Setups — save and categorize your trading setups for reference
- Diary — free-form notes for daily reflections, market observations, and lessons learned
The Workflow
- Step 1: Import your trades via CSV or add them manually.
- Step 2: Check the MIRROR panel — how many panic sells and FOMO buys this period?
- Step 3: Review Best/Worst Timed trades to understand your timing patterns.
- Step 4: Click a position's symbol to review the trade on the chart with entry/exit markers.
- Step 5: Write reflections in the Diary tab. Track what you're learning.
- Step 6: Over time, aim to reduce MIRROR flags and improve your profit factor.
Start Journaling
Import your trades and let MIRROR show you what emotions are costing you.
Launch TacticScale