Three Panels, One Unified View
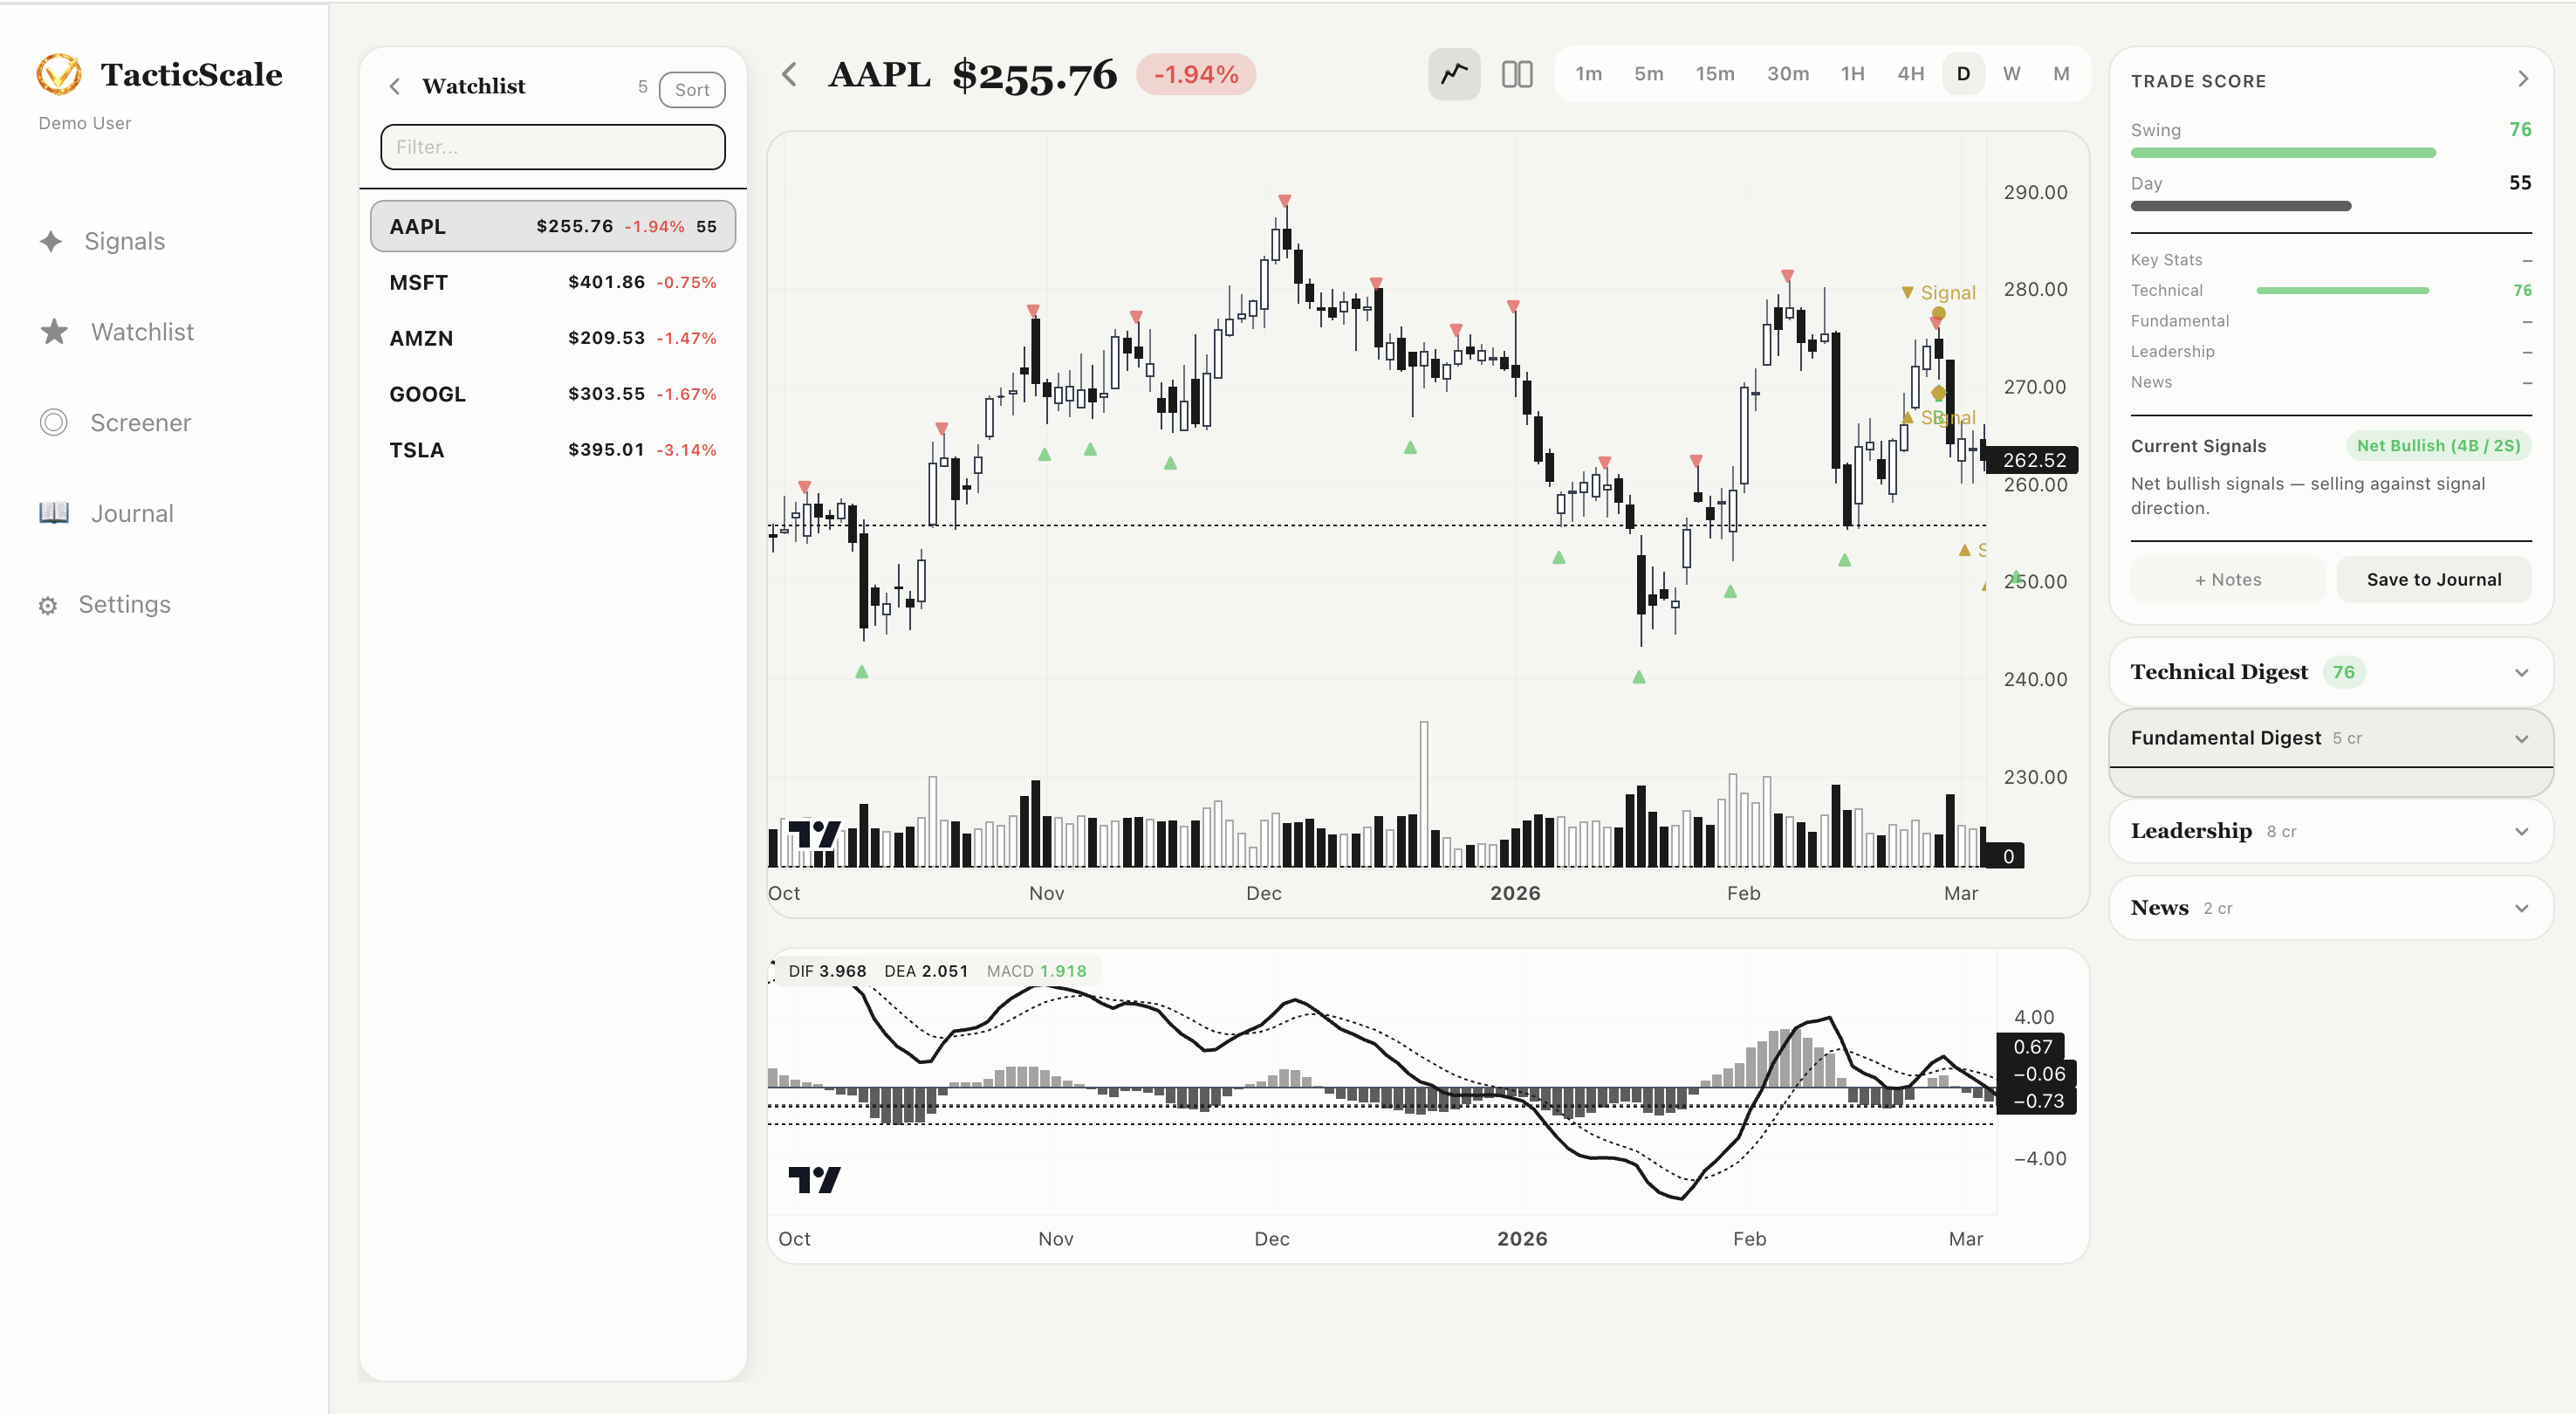
The chart analysis page is where you spend most of your time in TacticScale. It combines three panels into a single workspace: a ticker list on the left, the main chart in the center, and an insight panel on the right.
Left Panel: Quick Ticker Navigation
The left panel shows your current watchlist with live prices and daily percentage changes. Click any ticker to instantly load its chart. This lets you quickly flip through stocks without going back to the signals or watchlist page. Each ticker displays its current price and change percentage, color-coded green or red.
Center: Interactive Candlestick Chart
The main chart area is powered by lightweight-charts and displays:
- Candlestick chart — full OHLC price action with zoom (mouse wheel) and pan (click and drag)
- Pivot markers — colored triangles marking detected pivot highs and lows on the price chart
- Signal markers — icons showing where bullish or bearish divergence signals were detected
- Volume bars — shown at the bottom of the price chart
- MACD indicator — displayed in a synced sub-chart below, showing the MACD line, signal line, and histogram
Timeframe buttons along the top (1m, 5m, 15m, 30m, 1H, 4H, D, W, M) let you switch between different time horizons instantly. The chart and MACD stay perfectly synced as you navigate.
Reading the Pivot Markers
Green upward triangles mark pivot lows (potential support). Red downward triangles mark pivot highs (potential resistance). When you see a signal icon near a pivot, it means the detector found a divergence between the price pivot and the MACD momentum at that point — a potential reversal signal.
Right Panel: Trade Score & AI Insights
The right panel is where TacticScale goes beyond raw chart data. From top to bottom:
- Trade Score — a composite rating for Swing and Day trading suitability, displayed as a progress bar (e.g., Swing: 76, Day: 55)
- Key Stats — fundamental data like market cap, P/E ratio, and sector
- Current Signals — a summary of active signals for this ticker, with direction and reasoning
- Technical Digest — AI-generated summary of the technical picture (credit-based)
- Fundamental Digest — AI-generated summary of fundamentals and earnings (credit-based)
- Leadership — AI-analyzed management quality and insider activity (credit-based)
- News — AI-digested recent news headlines with sentiment analysis (credit-based)
Credits for AI Features
The Technical Digest, Fundamental Digest, Leadership, and News sections use credits. Each section shows its credit cost (e.g., "3 cr" or "5 cr"). New accounts receive free credits to try these features. The AI digests distill complex information into concise, actionable summaries — so you get the insight without spending hours reading SEC filings or parsing news feeds.
The Workflow
A typical chart analysis session looks like this:
- Step 1: Click a ticker from the Signals page, Watchlist, or Screener to open the chart.
- Step 2: Check the Trade Score for a quick read on suitability.
- Step 3: Review the candlestick chart — zoom into the signal area, check the pivot markers, read the MACD for momentum confirmation.
- Step 4: Read the Current Signals summary for the detector's reasoning.
- Step 5: Optionally spend credits on Technical Digest, News, or Leadership for deeper context.
- Step 6: Click "Save to Journal" to log your analysis or add notes.
Explore the Charts
Interactive candlestick charts with MACD, pivots, and AI insights — all in your browser.
Launch TacticScale