Your Command Center for Signal Discovery
The Signals page is the first thing you see when you open TacticScale. It gives you an instant overview of what's happening across your entire watchlist — which tickers have active signals, whether they're bullish or bearish, and how strong each signal is.
Summary Cards at a Glance
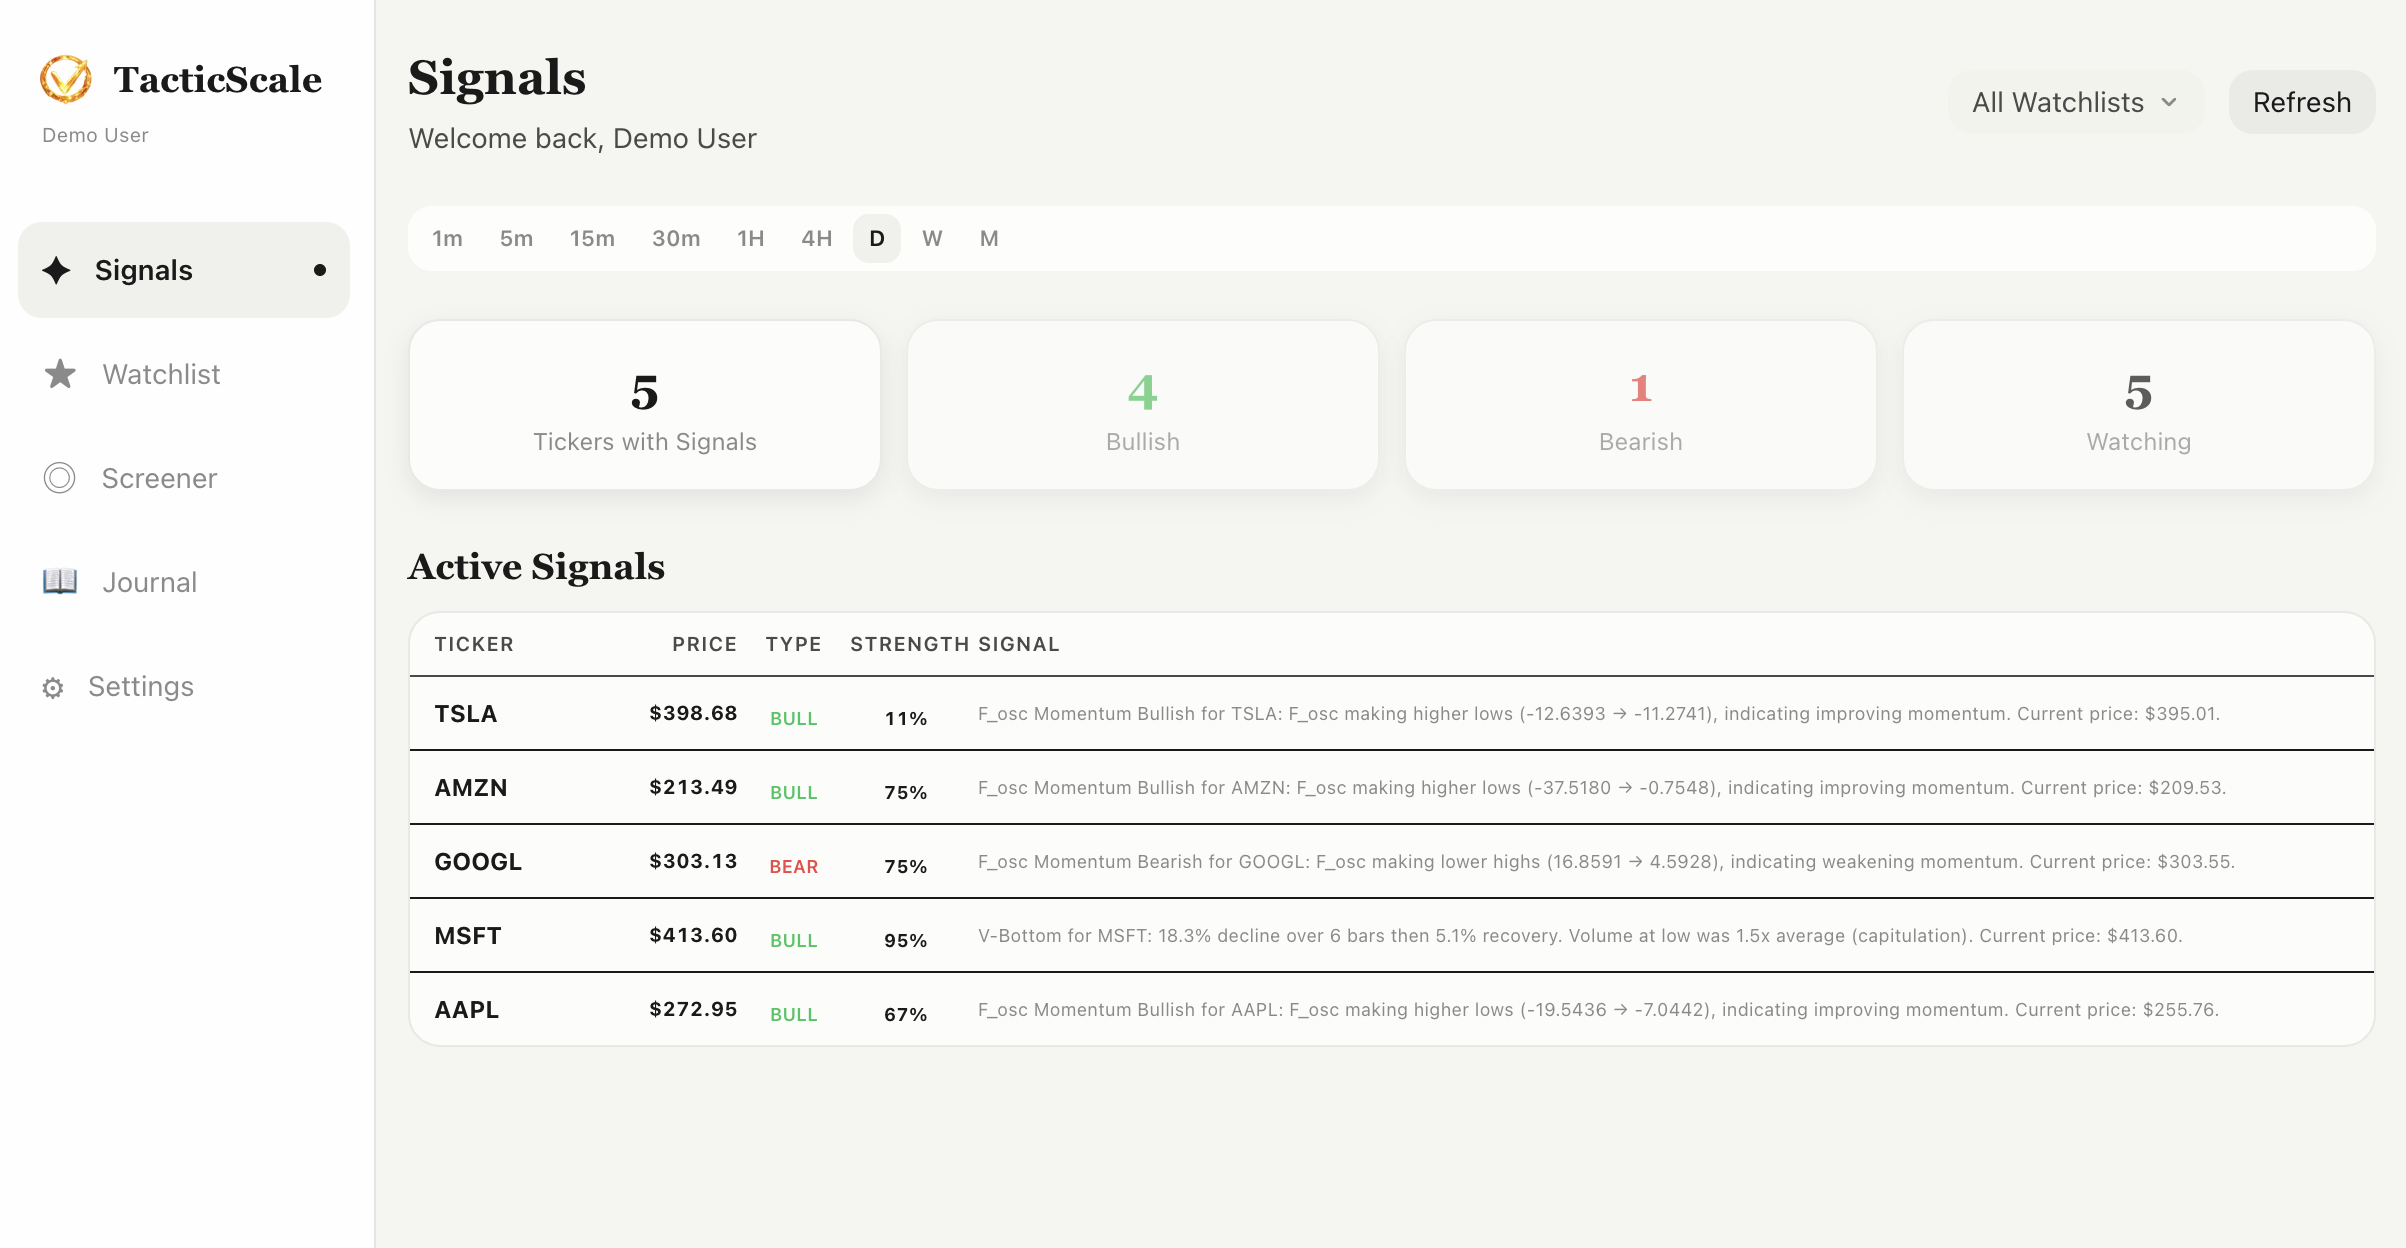
At the top of the dashboard, four summary cards give you the big picture:
- Tickers with Signals — how many stocks in your watchlist currently have active signals
- Bullish — the count of tickers showing bullish divergence signals (highlighted in green)
- Bearish — the count of tickers showing bearish divergence signals (highlighted in red)
- Watching — total number of tickers in your active watchlist
This lets you immediately gauge market sentiment across your universe without scrolling through individual charts.
Timeframe Filters
Above the summary cards, you'll find timeframe filter buttons: 1m, 5m, 15m, 30m, 1H, 4H, D, W, and M. These control which timeframe's signals are displayed in the list below.
Matching Timeframes to Your Style
Day traders typically focus on 1m to 1H timeframes for quick setups. Swing traders look at 4H and Daily. Position traders and investors scan Weekly and Monthly for macro-level divergences. You can also select "All Watchlists" in the top-right to scan across multiple watchlists at once.
Active Signals List
The heart of the dashboard is the Active Signals table. Each row shows:
- Ticker — the stock symbol
- Price — current market price
- Type — BULL (green) or BEAR (red) signal badge
- Strength — a percentage score indicating signal confidence
- Signal — a plain-English description of what the detector found, including the divergence type, price levels, and momentum context
Signals are ranked by strength score, so the most compelling setups appear at the top. In the screenshot, TSLA shows a momentum bullish signal at 11% strength, while GOOGL has a bearish signal at 79% — the list puts the strongest conviction signals front and center.
The Workflow
Here's a typical workflow on the Signals page:
- Step 1: Open TacticScale. The scanner automatically runs across your watchlist.
- Step 2: Check the summary cards for a quick market read.
- Step 3: Select a timeframe that matches your trading style.
- Step 4: Review the ranked signal list. Read the signal descriptions to understand the setup.
- Step 5: Click any ticker to open the full chart analysis page with MACD, volume, and AI-powered insights.
Background Scanning with Smart Caching
TacticScale scans tickers in the background with timeframe-aware TTL caching. Shorter timeframes refresh more frequently (minutes), while weekly and monthly signals cache longer. Hit the "Refresh" button anytime to trigger a fresh scan.
Try It Now
Start scanning for signals across your watchlist — free, no download required.
Launch TacticScale