A calm, powerful way to explore, debug, and present your data.
Where data whispers its secrets,
and patterns rise from complexity;
Where cells cascade like water,
and every change feels gentle and clear—
This is the Jupie Way.
Real questions. Thoughtful answers.
One tender click, and Claude sees everything — your code, your errors, your journey. Like a trusted confidant who truly understands.
Data Lens opens a window into your data's soul. Peek inside any variable, at any moment, and watch its story unfold.
Every cell remembers. Cell-level history captures each gentle evolution, so you never lose the thread of your work.
Your pipeline becomes a constellation of light. Each connection visible, each dependency illuminated. Know before you leap.
Watch cells bloom in parallel, like flowers opening at dawn. 3-5x faster, while your code remains untouched.
Let it flow. Cross-notebook imports as natural as breathing. Finally, harmony across your work.
Elegant views that make complex Jupyter notebooks simple
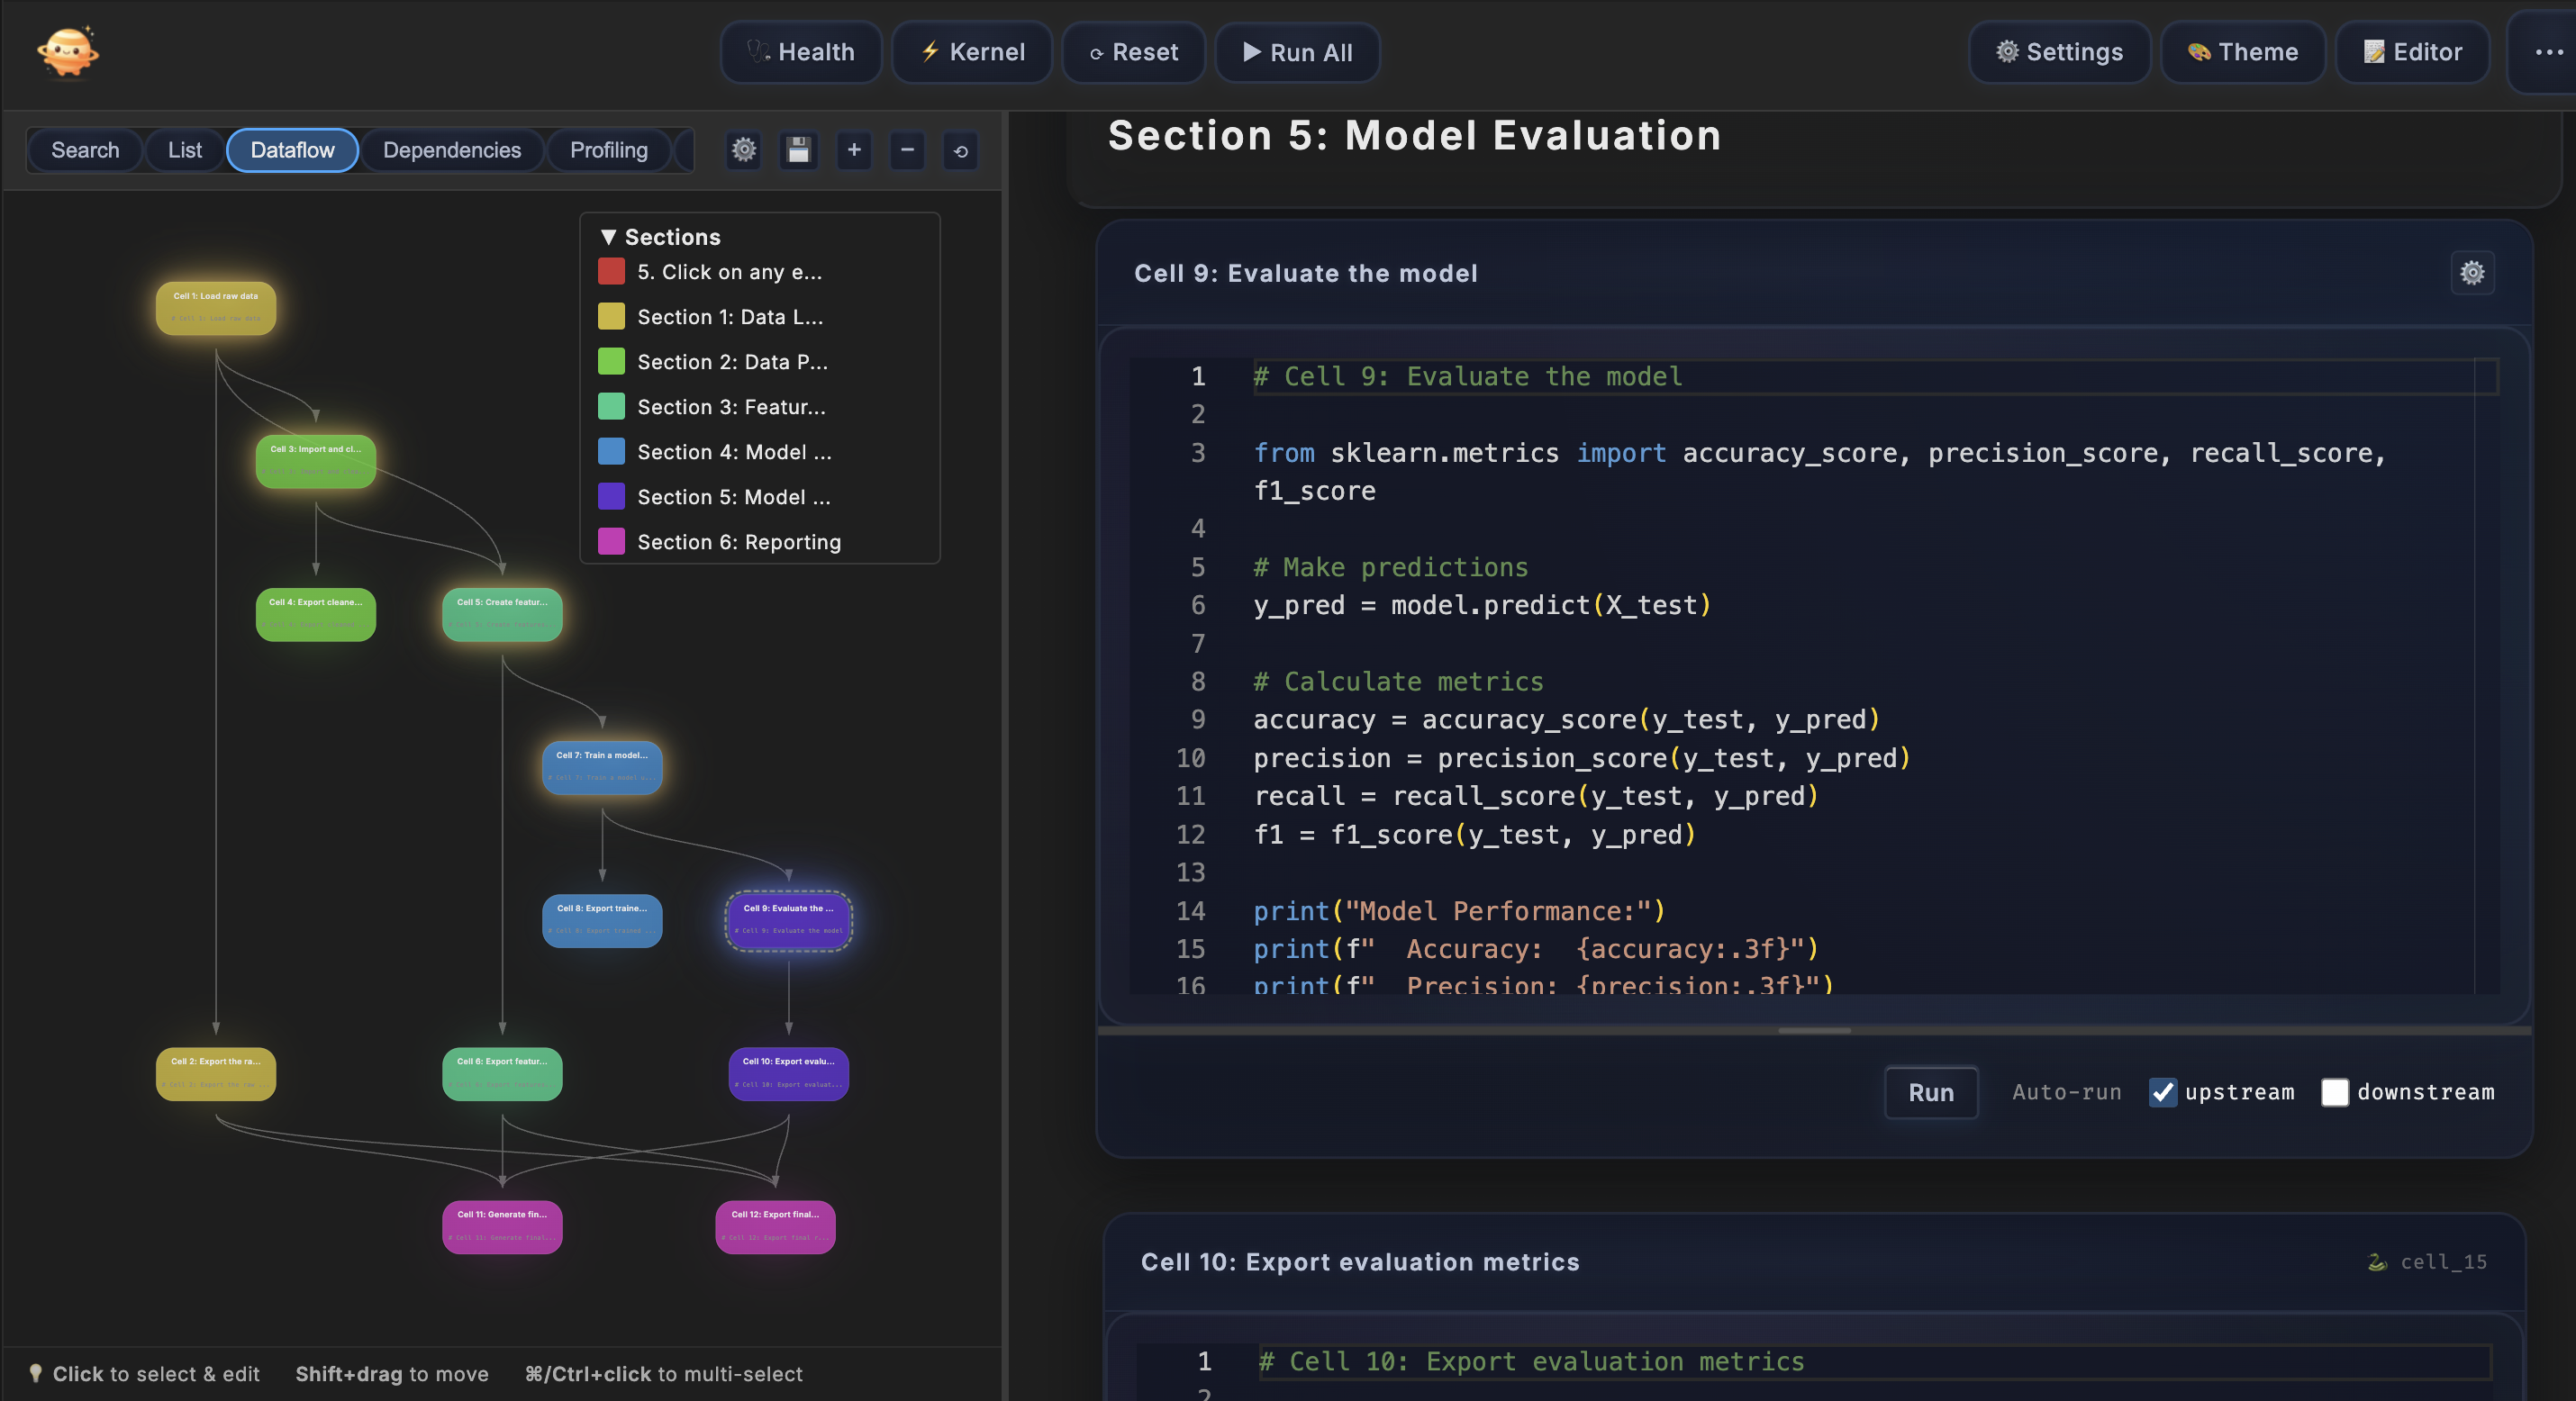
Your notebook as poetry in motion. See the dance of data at a glance.
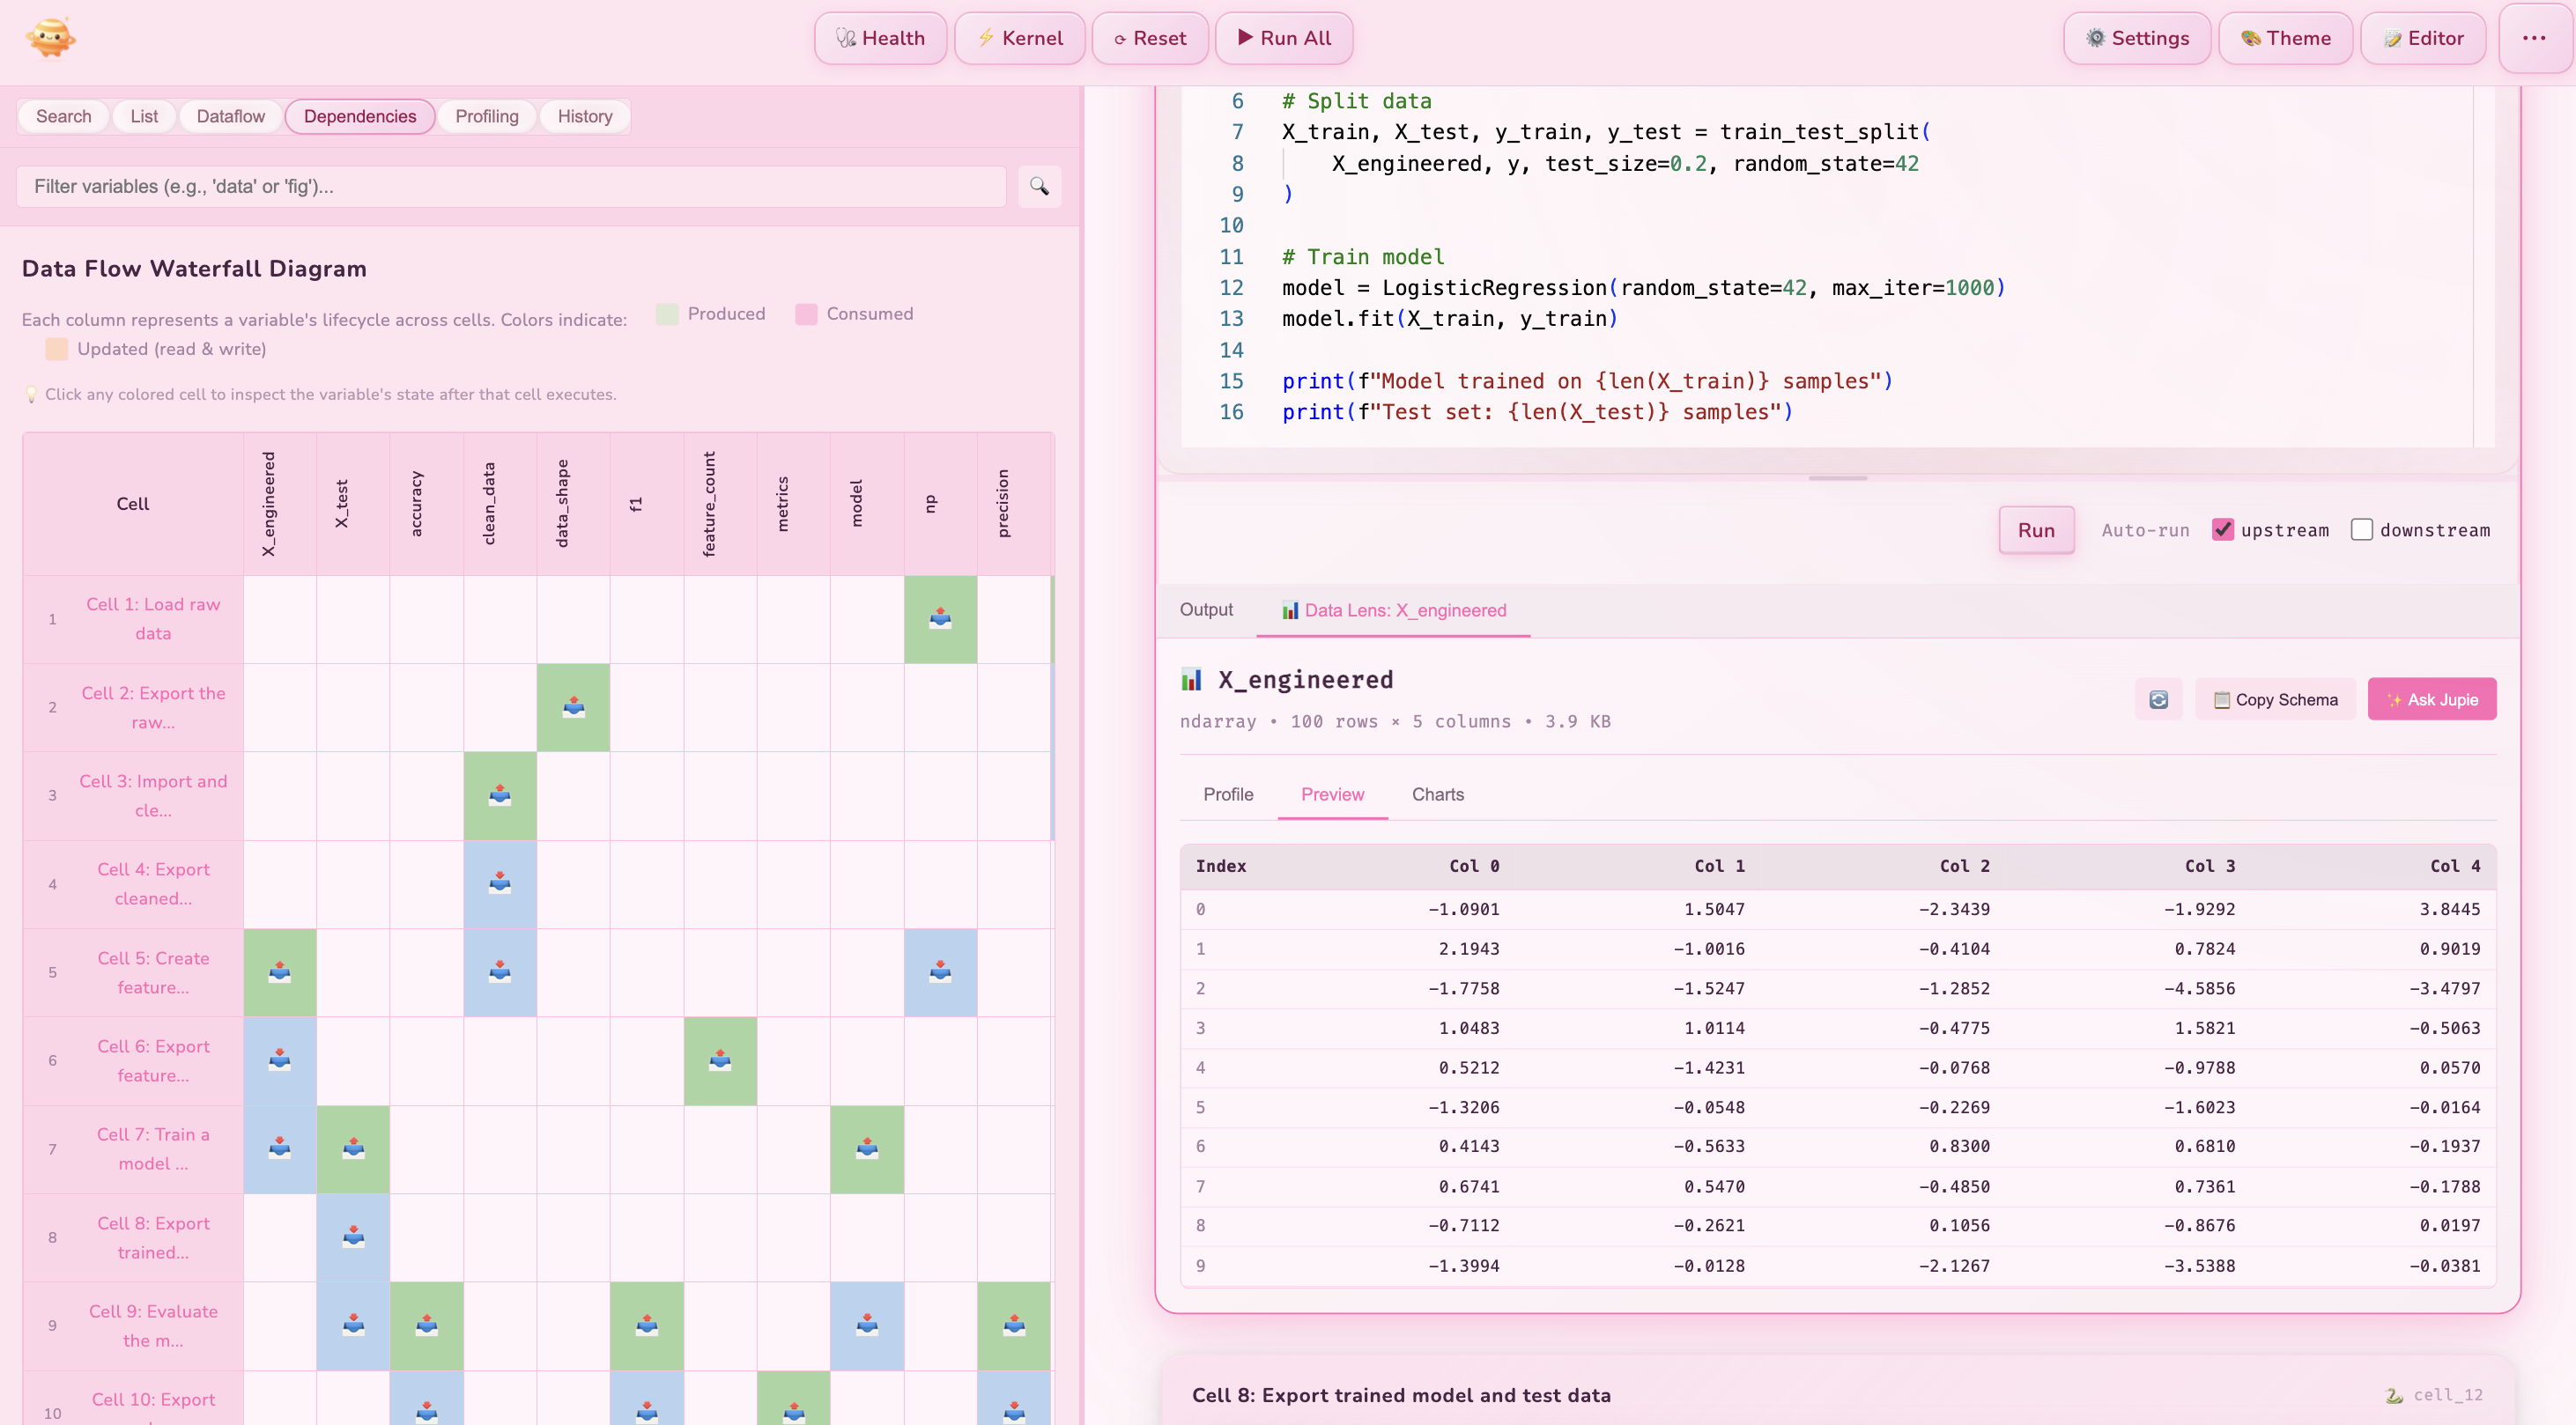
A window into your data's heart. Inspect any variable, at any moment in its journey.
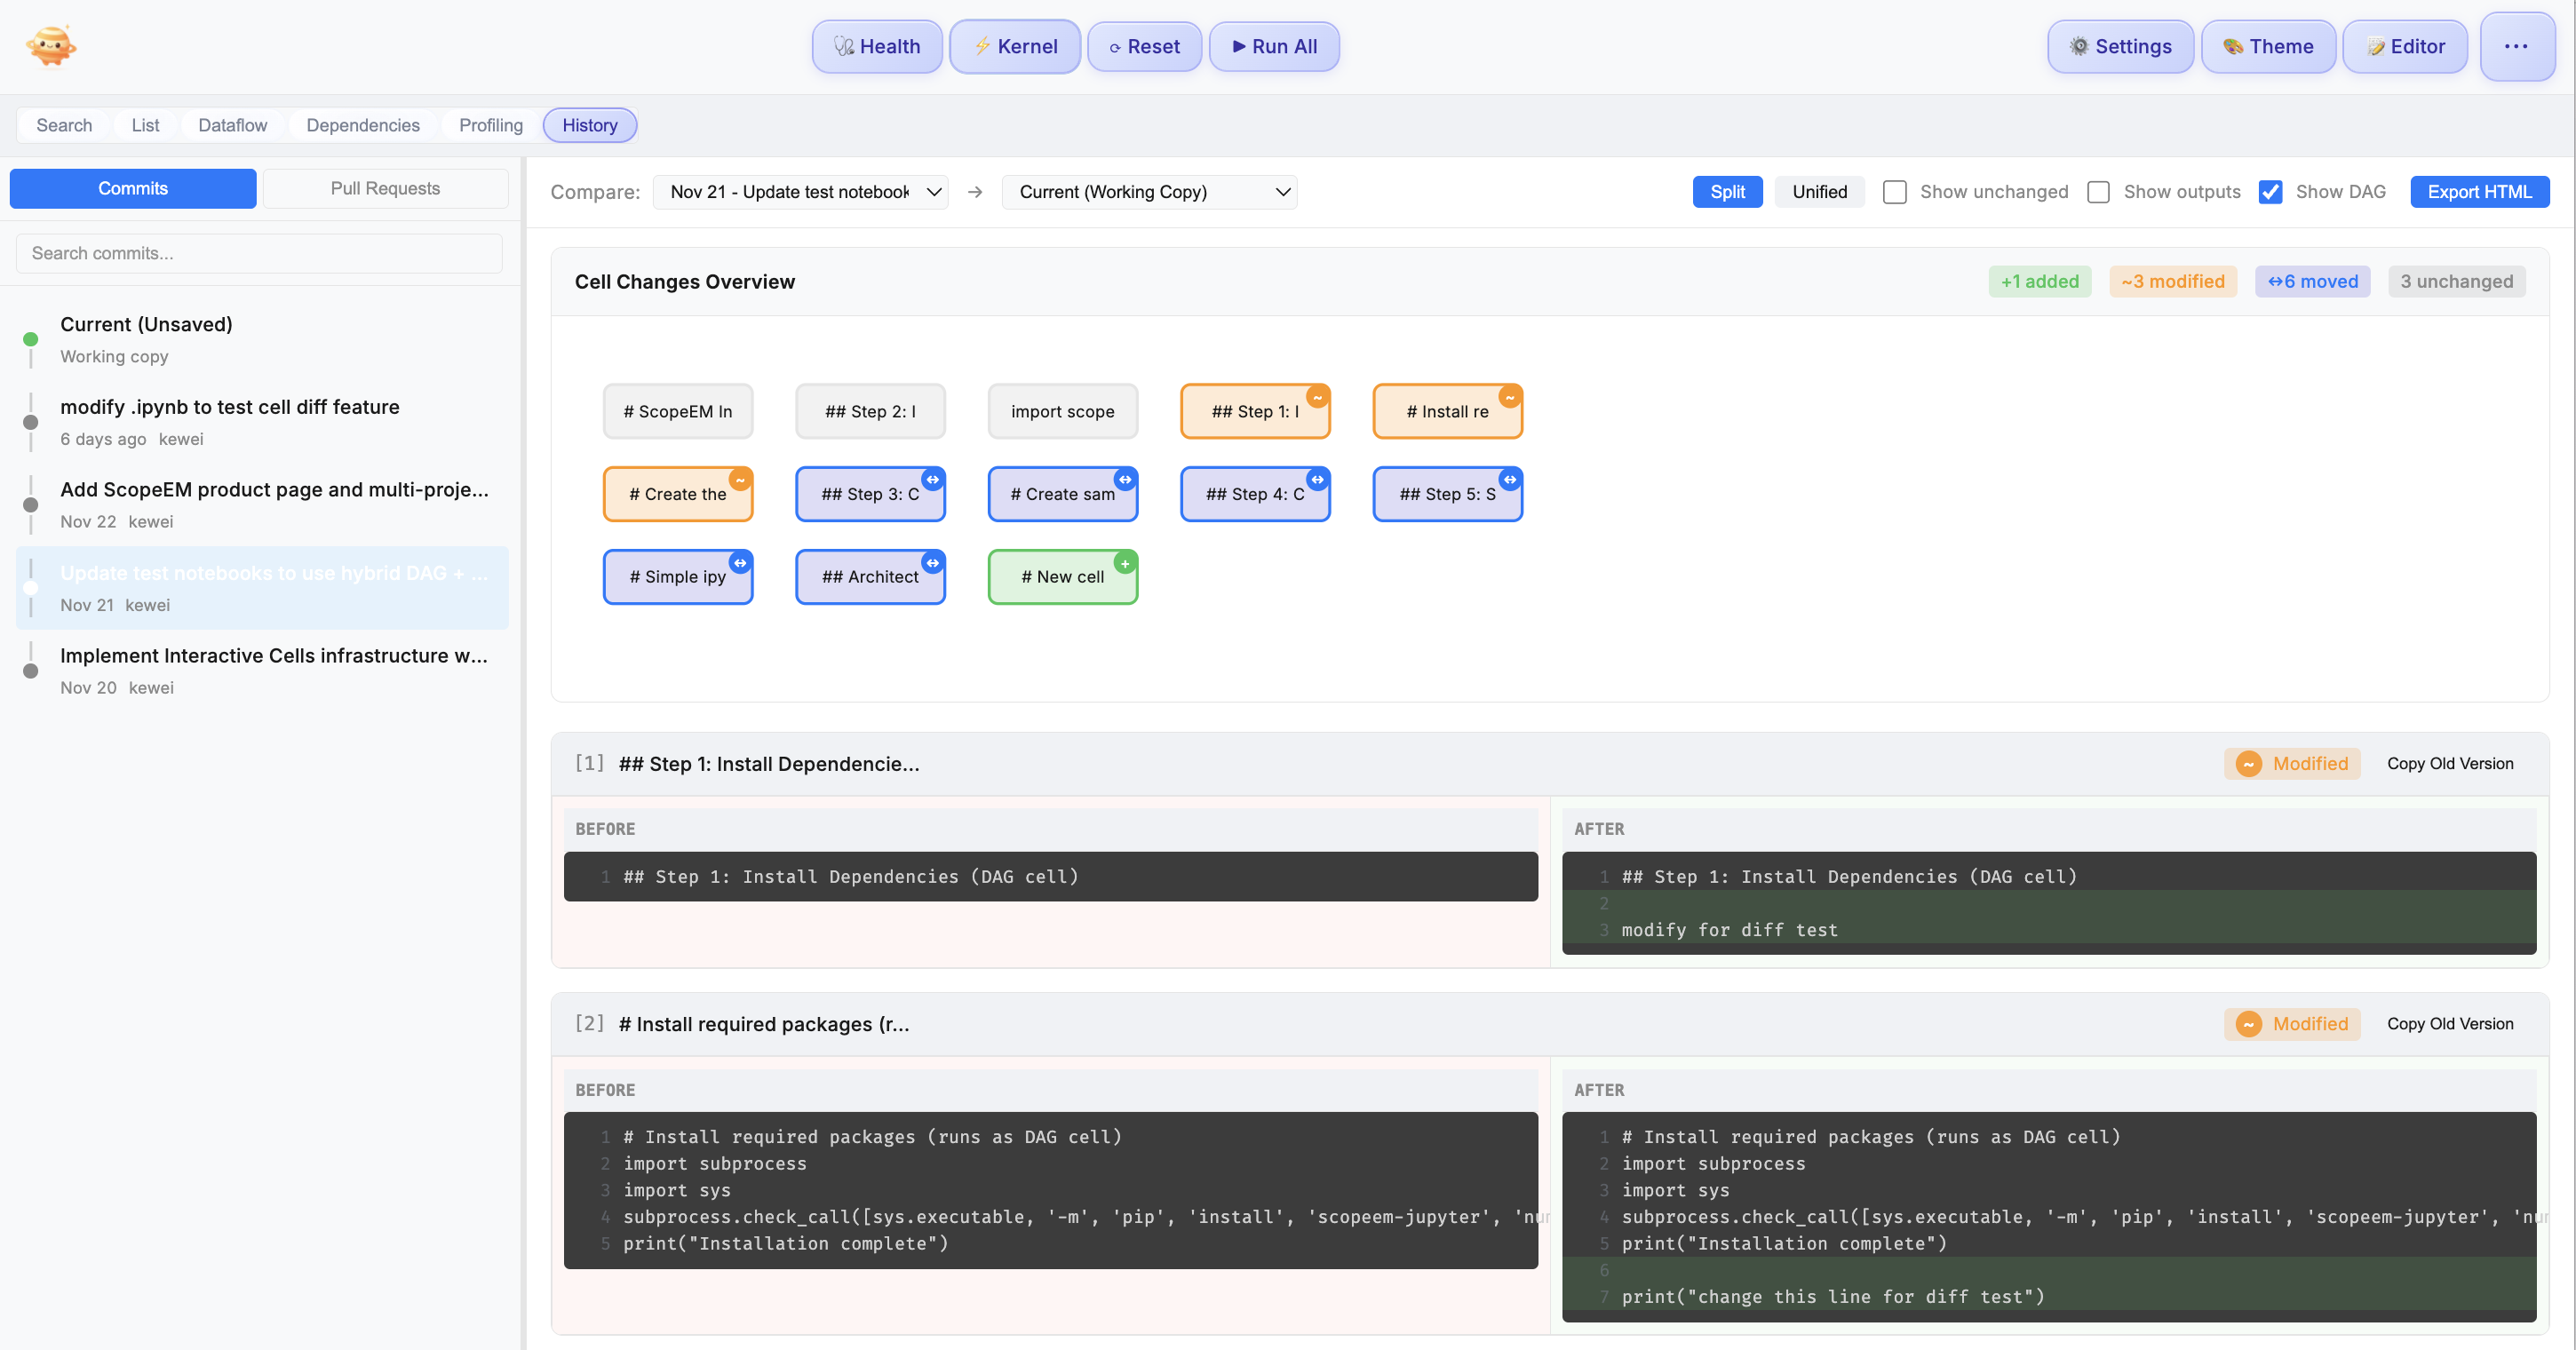
Every cell tells its own story. Track changes, compare moments, never lose your way.
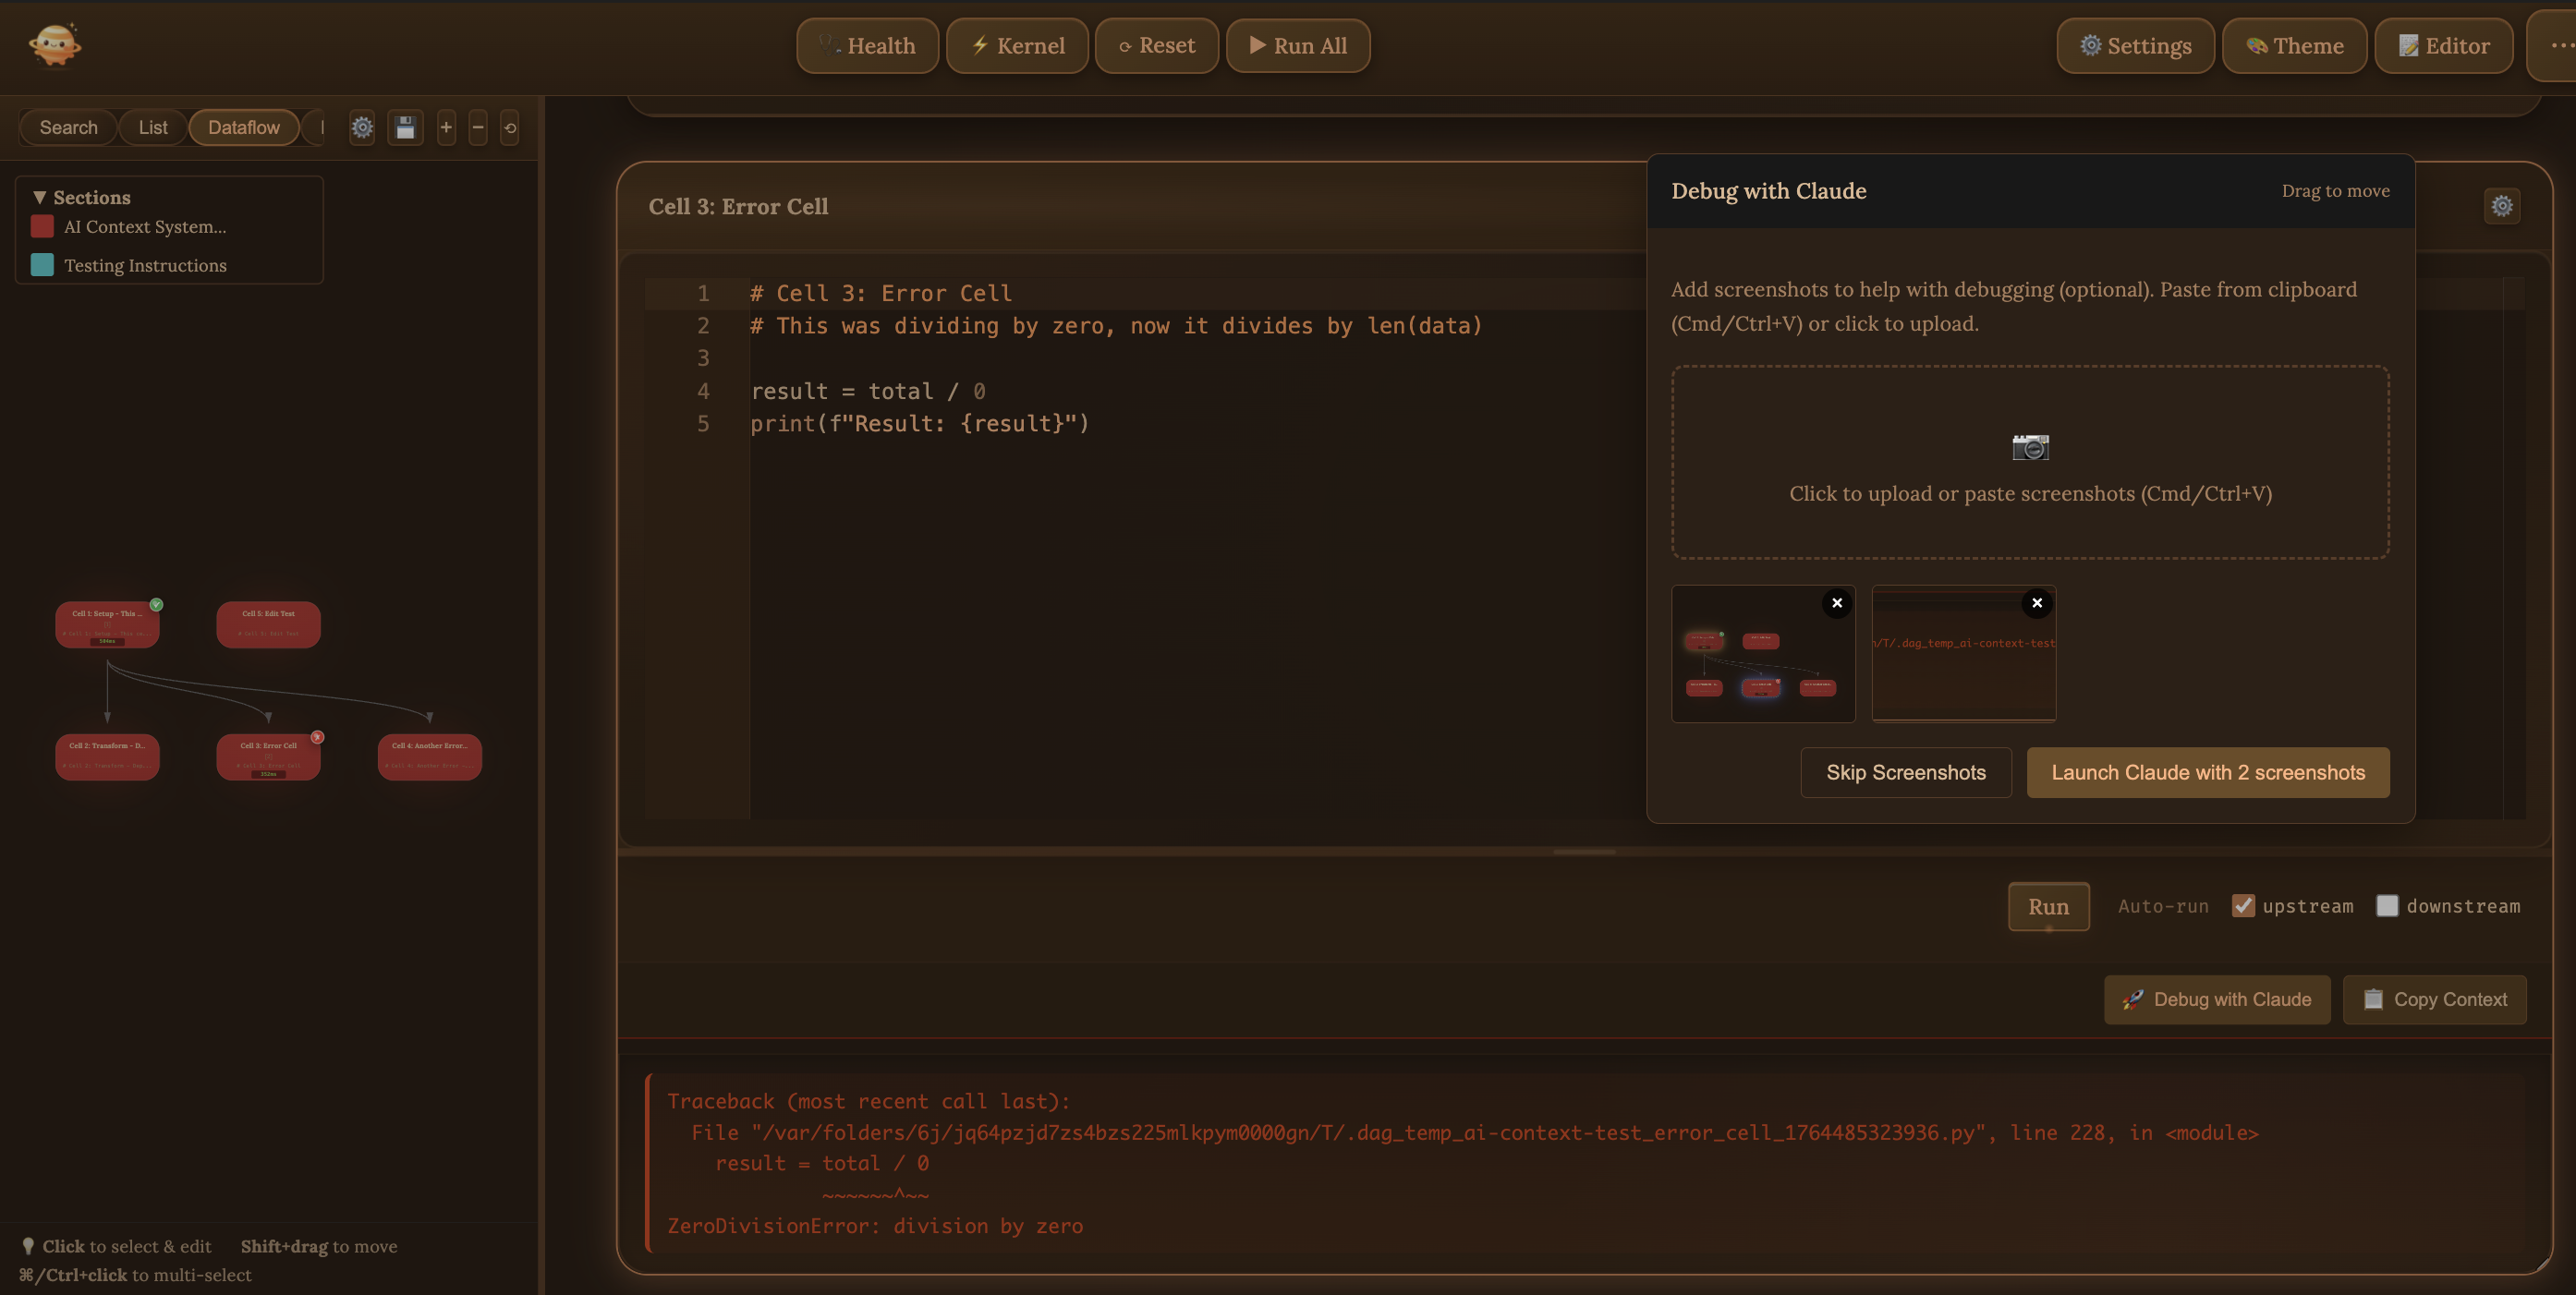
Claude becomes your gentle guide. One click, and it understands your entire journey.
A powerful side-panel inspector that transforms notebook outputs into navigable, structured views
Jupie Data Lens is our answer to a simple belief with radical consequences: data science shouldn't just be correct—it should be gorgeous, legible, and instantly meaningful. Most tools treat data as a grid you must wrestle into insight, but Jupie flips that relationship so your data arrives already ready for story, already ready for sharing, and already ready to make you look brilliant. At the heart of Data Lens is a new way of seeing: structure is not something you passively find in static data; structure is something you generate through motion—by moving along the right dimension, slicing by the right cohort, or rotating what matters into the foreground. Jupie treats observation as a path, not a snapshot, which is why Data Lens isn't "just prettier charts"; it's an observation engine that makes structure emerge. In that sense, Jupie Data Lens is not a feature but a declaration: we don't just show data—we build ways of seeing.
See schema, data types, missing values, and statistics at a glance. No more writing df.info() and df.describe() for every variable.
Switch between traditional table view and visual heatmap mode. See patterns, gradients, and anomalies instantly with zoom and pan controls.
Automatic distribution charts for all numeric columns. Understand your data's shape without writing a single line of plotting code.
Run clustering (K-Means, Hierarchical, DBSCAN) or supervised learning with one click. Get 3D PCA visualizations and generated code for reproducibility.
Track how your data transforms through cells. See schema changes, row counts, and memory usage as your data flows through the pipeline.
Your AI companion that understands your notebook's story and helps you uncover insights
Detective Jupie sees your entire notebook context—variables, outputs, errors, and history. Ask questions naturally and get answers that truly understand your work.
Click the microphone and speak your question. Detective Jupie transcribes and clarifies before sending, so your intent is perfectly captured.
Choose exactly which events to analyze—all, last N, or a custom range. Control your token costs while getting the insights you need.
Responses are rendered with full markdown support—code blocks, tables, lists, and more. Technical answers that are a pleasure to read.
Turn any notebook into a beautiful presentation—click Present in the toolbar

Your markdown headers become slides instantly. No export, no conversion—just click Present and tell your story.
Plotly charts stay alive. Hover, zoom, and animate—your audience can explore the data with you.
Add private notes for yourself, and hide or reveal code with one click—perfect for any audience.
Keyboard shortcuts, slide outline, and intuitive controls. Present like a pro, feel like a poet.
Get started in minutes
Download the Jupie VS Code extension and install it in one click.
VS Code Marketplace →Open any Jupyter notebook (.ipynb file) with Jupie and see your data flow instantly.
Let your pipelines breathe. Understand deeply, execute gracefully.
See your model's journey. Let preprocessing flow in harmony.
Your experiments, elegantly organized. Every connection clear.
Show your students how code flows and data connects.
Jupie is a VS Code extension that transforms how you work with Jupyter notebooks. It provides one-click AI debugging with Claude, Data Lens for variable inspection, cell-level git history, and automatic dataflow visualization. Unlike standard Jupyter notebook editors, Jupie shows you exactly how your data flows and gives you powerful tools to debug, inspect, and collaborate.
When a cell fails, click 'Debug with Claude' and Jupie automatically sends rich context to Claude Code: your cell code, error traceback, upstream dependencies, variable states, and recent edit history. Claude understands your entire pipeline context without manual copy-pasting. You can also attach screenshots of visualizations for complete context.
Data Lens lets you inspect any variable at any point in your data pipeline. Click any colored cell in the waterfall diagram to see the variable's state after that cell executes. View DataFrame previews, array shapes, statistics, and more. Perfect for understanding how data transforms through your notebook.
Jupie provides cell-level diff views for your notebook's git history. See exactly which cells changed between commits, compare versions side-by-side, and restore old cell code with one click. No more wrestling with JSON diffs. GitHub PR integration lets you review and comment on specific cells during code review.
While JupyterLab and Jupyter Notebook are excellent for basic notebook editing, Jupie adds advanced features specifically for data scientists working with complex workflows. Jupie provides one-click AI debugging, Data Lens for variable inspection, cell-level git history with GitHub PR support, automatic DAG visualization, and parallel cell execution.
Yes! Jupie works seamlessly with all standard .ipynb files. Simply open your existing Jupyter notebooks in VS Code with Jupie installed, and immediately access all features. No conversion or migration needed.
Use @jupie-export variable_name to expose variables and @jupie-import variable_name from notebook to import them. It's like Unix pipes for notebooks—chain data prep, feature engineering, training, and evaluation into modular pipelines. Create a workspace (.ipynbw file) to orchestrate and run all notebooks together with automatic parallel execution.
Yes! Jupie supports both local Python execution and remote Jupyter servers. Connect to any Jupyter server and all features work including parallel execution. Cross-notebook exports/imports use pickle files on the server, so multi-notebook workflows work seamlessly in remote environments too.
After installing, open the Command Palette (Cmd/Ctrl+Shift+P) and search for "Jupie Tutorial" to generate interactive tutorial notebooks. Choose Quick Start (5 min), Full Tutorial (15 min), or Advanced Workshop for multi-notebook orchestration. Tutorials are created in your workspace and guide you through all features.